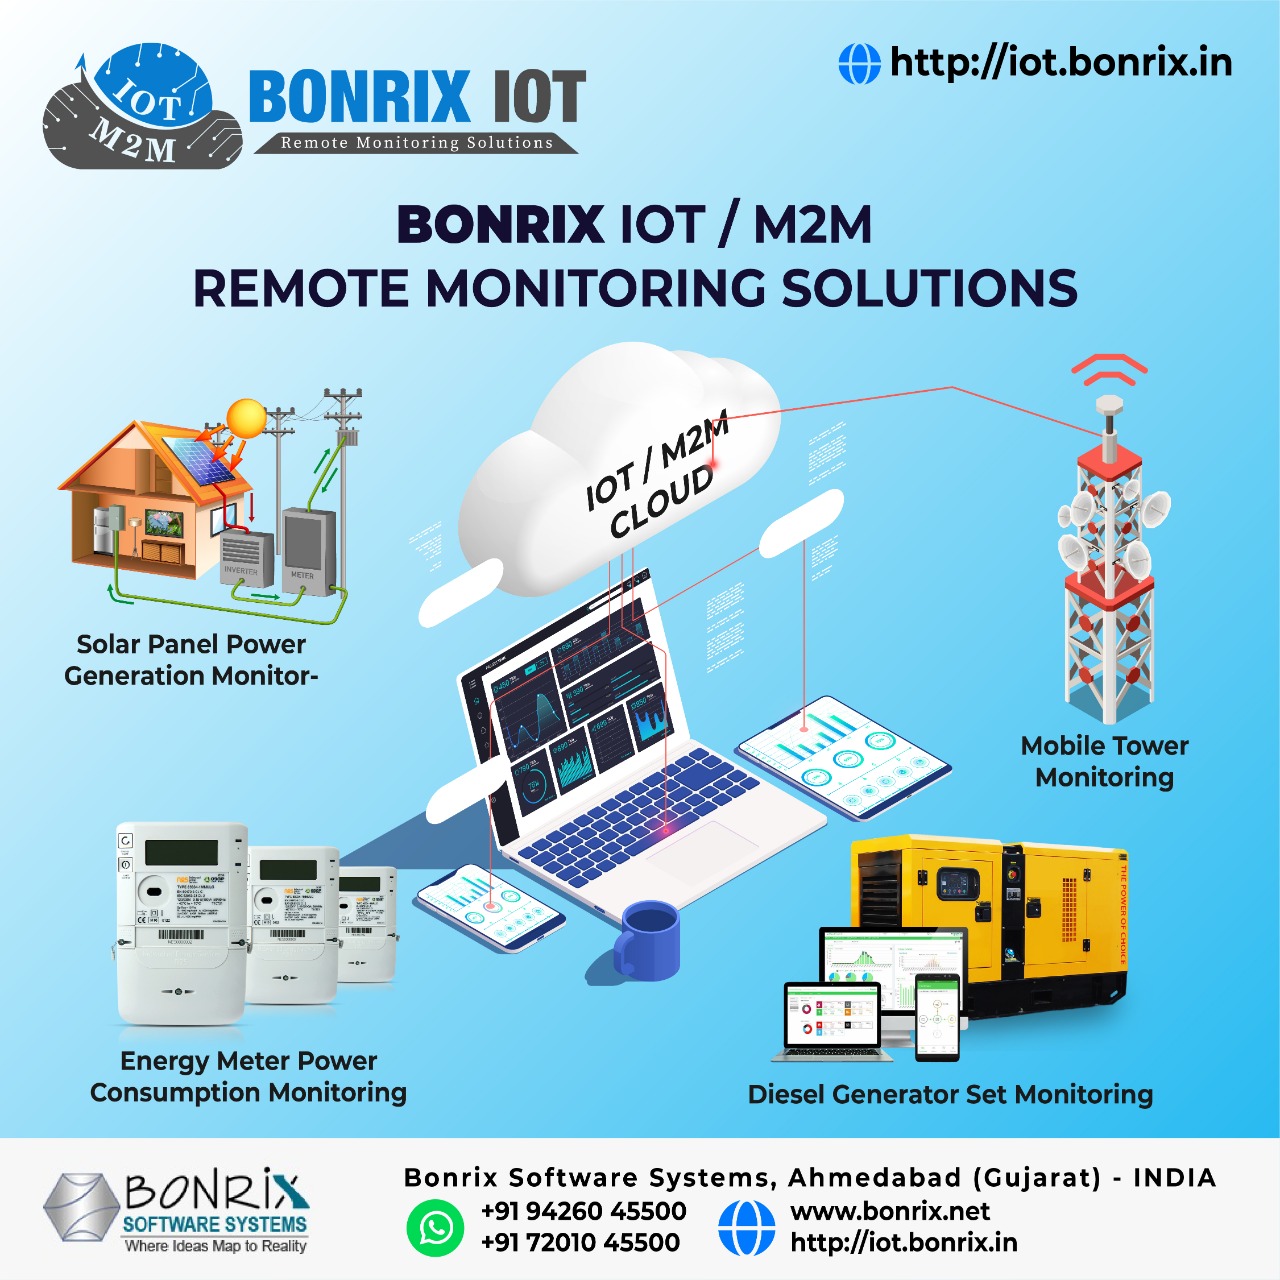
Bonrix IOT / M2M Remote Monitoring Solutions
• IOT/M2M Cloud Service for Device Data Capturing• Solar Panel Power Generation Monitoring Mobile Tower Monitoring
• Diesel Generator Set Monitoring Energy Meter Power Consumption Monitoring
Bonrix Software Systems, Ahmedabad (Gujarat) - INDIA
+91 94260 45500 | +91 63524 45500 | +91 94290 45500
www.bonrix.co.in | www.bonrix.net | www.bonrix.in
- The first point mentions an IoT/M2M cloud service that can capture device data, which suggests that the company can provide a platform for remotely monitoring devices and collecting data from them.
- The following examples provide specific use cases, such as solar panel power generation monitoring, mobile tower monitoring, diesel generator set monitoring, and energy meter power consumption monitoring.
- This suggests that the company can provide solutions for tracking the performance and usage of various devices, which can be useful for maintenance and optimization purposes.
- Overall, these types of IoT/M2M remote monitoring solutions can be valuable for businesses that have a need to track the performance of devices or equipment, particularly in remote or hard-to-reach locations.
- By leveraging IoT and M2M technologies, these solutions can enable real-time monitoring and data collection, which can help with proactive maintenance and avoiding downtime.
.png)
.png)
.png)
.png)
.png)
.png)
.png)
.png)
.png)
.png)
.png)
.png)
.png)
.png)
.png)
.png)
.png)
.png)
.png)
.png)
.png)
.png)
.png)
.png)
.png)
.png)
.png)
.png)
.png)
.png)
.png)
.png)
.png)
.png)
.png)
.png)
.png)
.png)
.png)
.png)
.png)
.png)
.png)
.png)
.png)
🚀 Transforming Industrial Monitoring with Bonrix IoT/M2M Remote Device Monitoring System
In today’s connected world, industrial equipment and vehicle fleets demand real-time visibility, smarter analytics, and actionable insights. At Bonrix, we’ve designed a comprehensive IoT/M2M Remote Device Monitoring platform that empowers businesses to manage operations with precision and confidence.
🎥 This video demonstrates how our platform delivers end-to-end monitoring, analytics, and reporting — turning raw device data into meaningful operational intelligence.
🌟 Key Functionalities Showcased
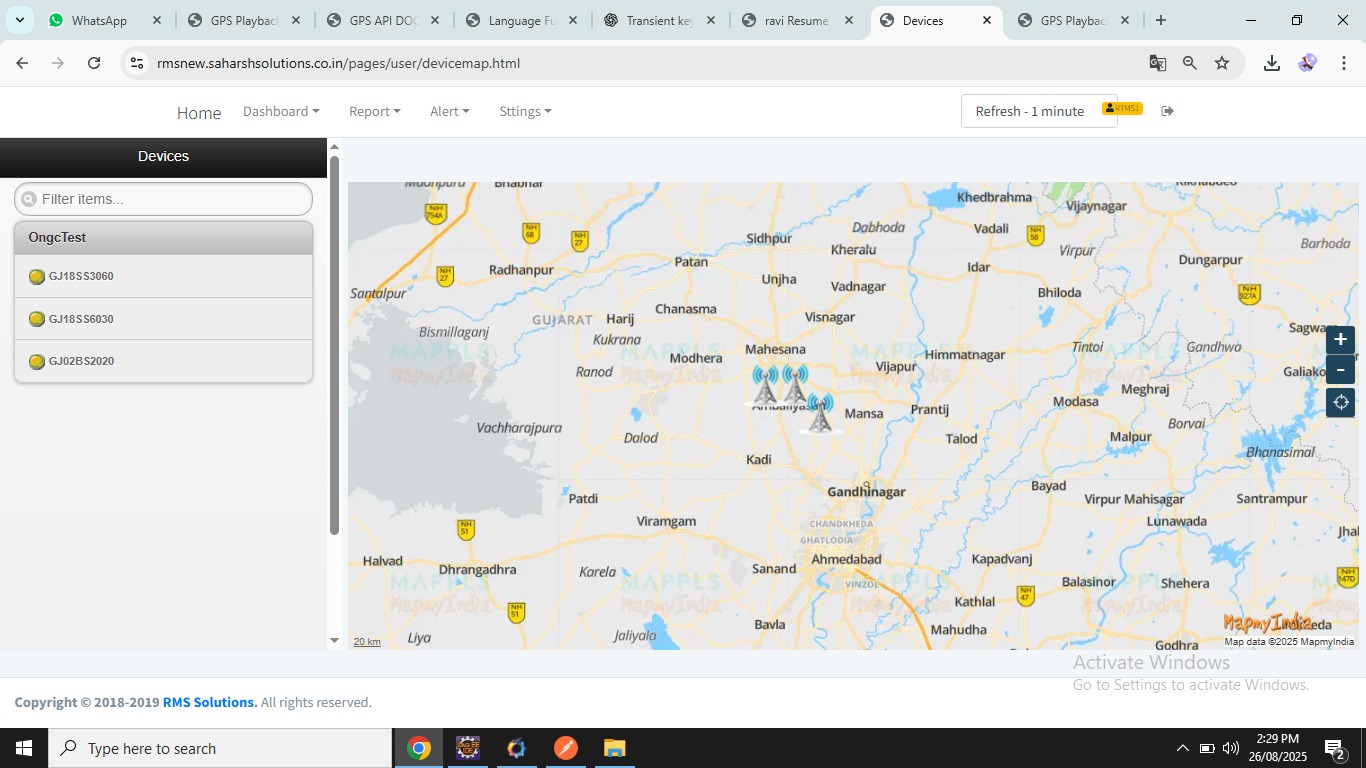
🔑 1. Secure Access & Device Management
Role-based login ensures data security.
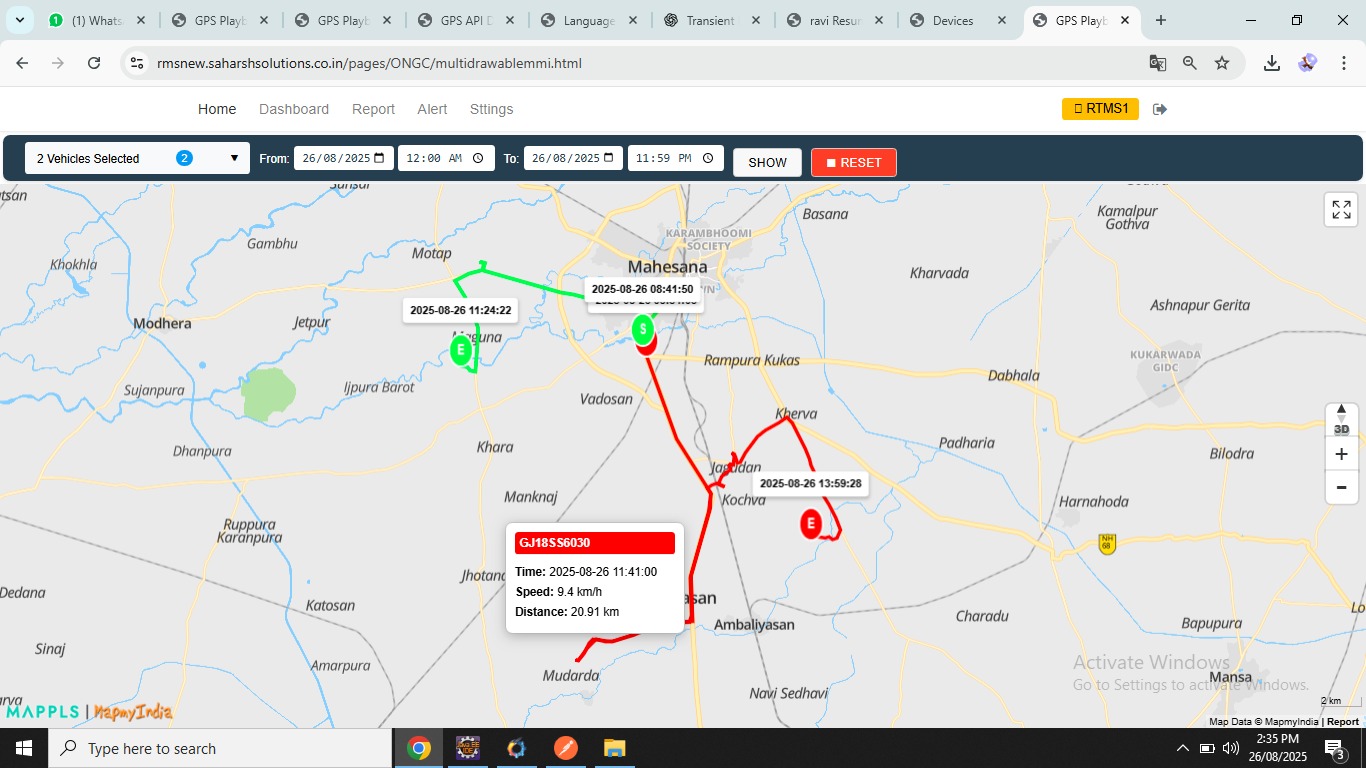
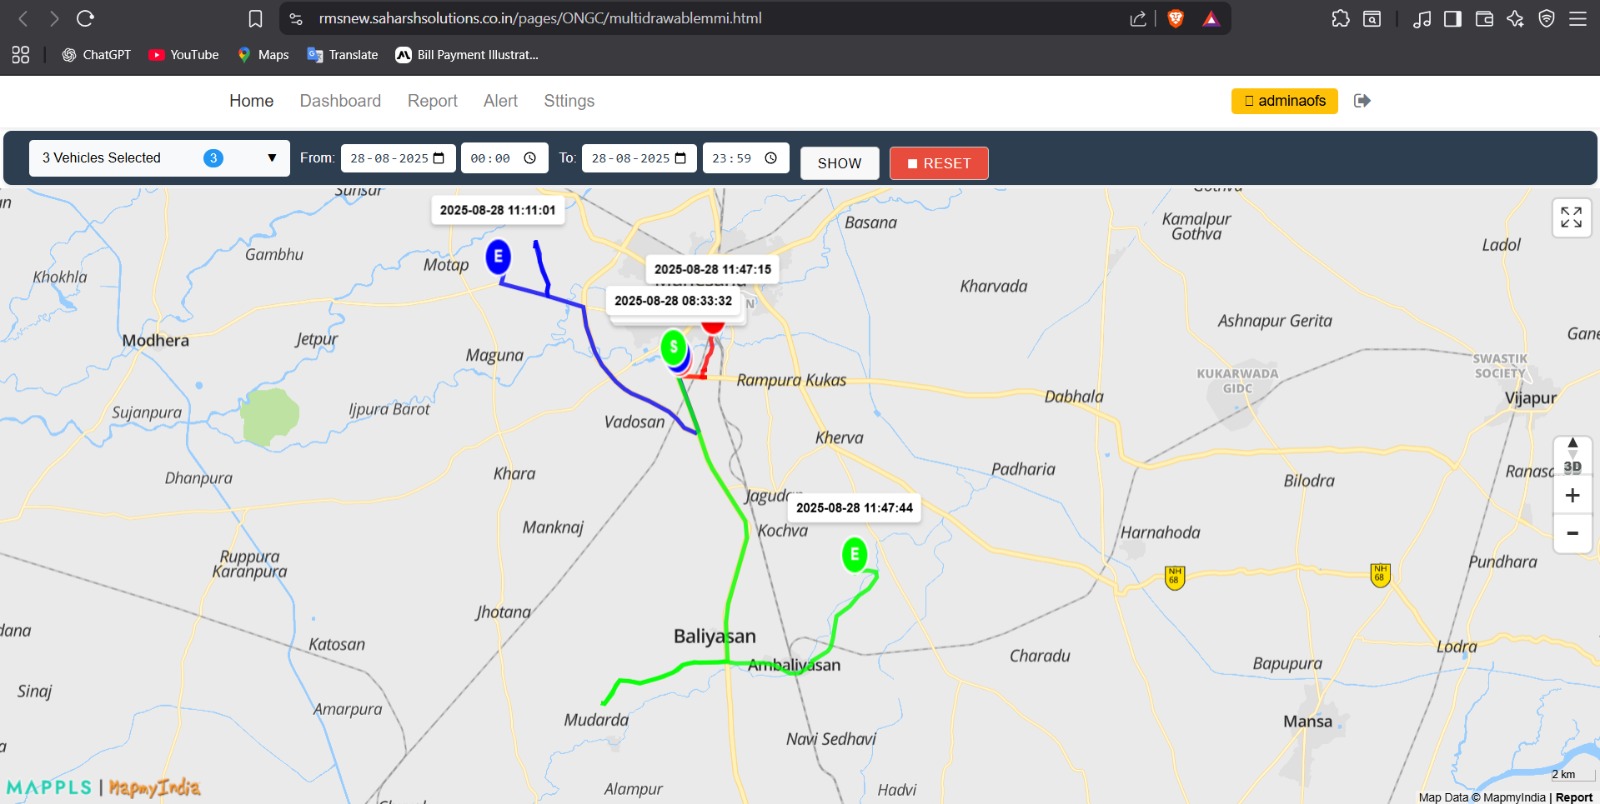
Operators can select specific devices (single or multiple) from their fleet or industrial assets.
Supports scalable device management, whether for a single unit or hundreds of distributed machines.
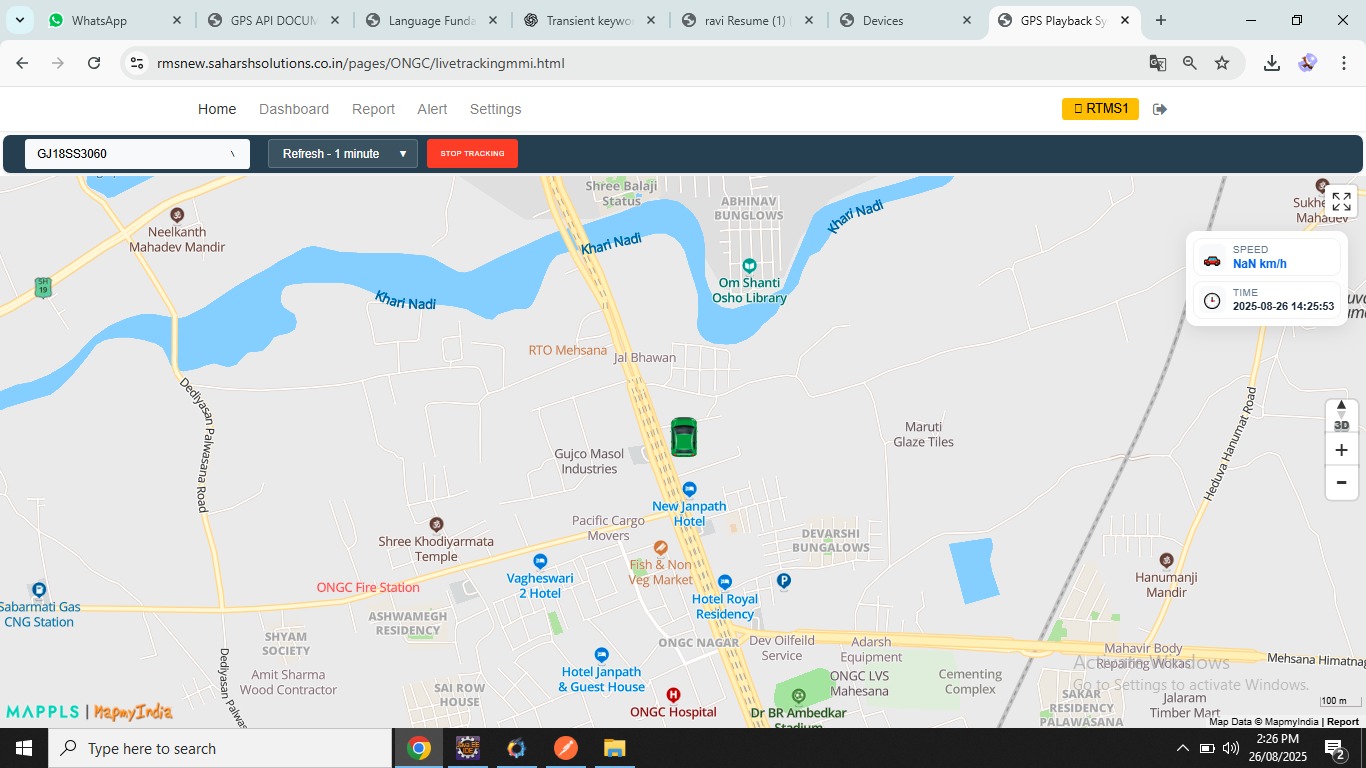
📊 2. Real-Time Monitoring Dashboard
At-a-glance health view of equipment and vehicles.
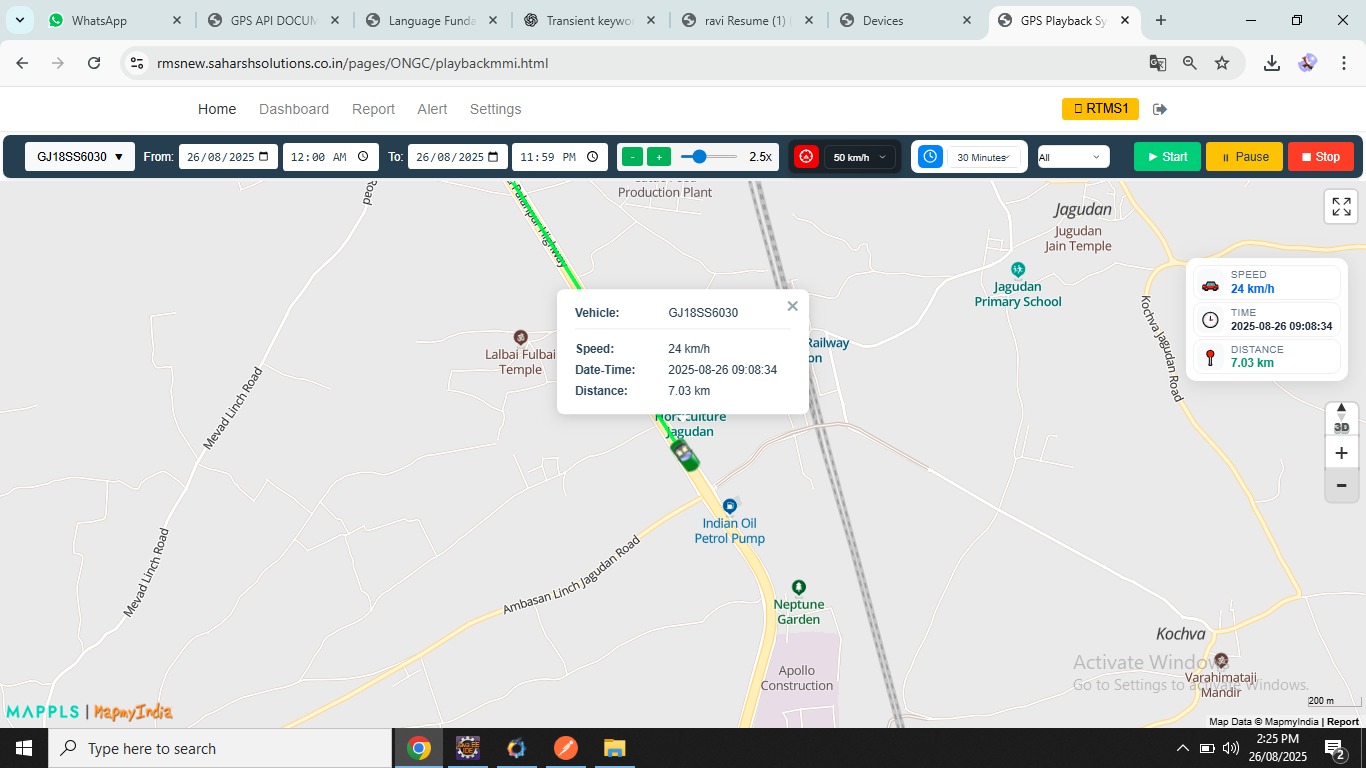
Live metrics for temperature, pressure, flow rate, odometer readings, and more.
Clear, color-coded alerts (e.g., “Low Pressure”, “Insufficient Flow”, “Low Water Level”) help detect anomalies immediately.
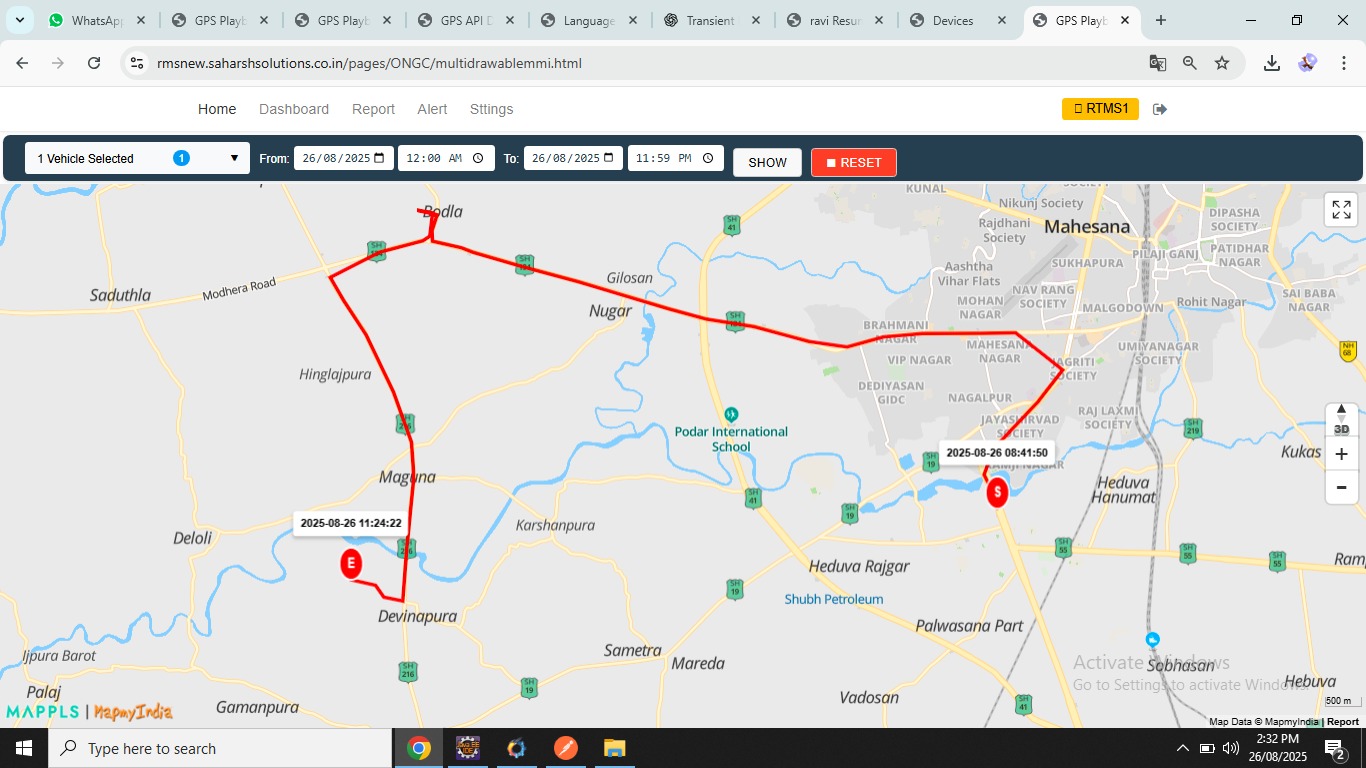
For vehicle fleets: integrated GPS status, ignition/boiler monitoring, and live gauges for performance.
📈 3. Historical Data & Trends
Powerful “View History” option for time-series data analysis.
Interactive line graphs to study performance trends over time.
Parameters include inlet/outlet temperatures, pump/compressor run hours, flow rates, pressure levels, and beyond.
Facilitates predictive maintenance by spotting irregularities before failures occur.
📝 4. Comprehensive Reporting Suite
Device Performance Reports: Multiple devices + custom date range → detailed reports with key stats like kilometers traveled, start/stop logs, pressure & temperature highs, and location data.
Trip Reports: Detailed breakdown of start/end times, locations, duration, and distance covered.
Parameter-Specific Reports: Focused reports on events like ACMAINS_FAIL or Ignition, offering granular event timelines.
Exportable in PDF, Excel, CSV — making it boardroom- and audit-ready.
📊 5. Data Visualization & Analytics
Rich, interactive charts: bar graphs for odometer trends, daily/monthly/yearly analysis, and compressor run-hour visualizations.
Enables operational benchmarking and identification of usage patterns.
Intuitive visuals convert complex telemetry into actionable insights.
🎛 6. Specialized Views & Profiles
Profile screens for device-specific configurations.
Cooling Matrix reports for deeper engineering diagnostics.
Pump metrics and compressor utilization available at a glance.
🖥 7. User-Friendly Interface
Clean, intuitive navigation with calendars, search functions, and filters.
Consistent workflow: Select Devices → Set Date/Time → Generate Report → Download/Export.
Designed for both technical engineers and business decision-makers.
🔔 8. Notifications (Proactive Alerts)
The notification framework ensures operators never miss critical events.
The video concludes with “No notifications yet”, but it signals readiness for real-time anomaly alerts — keeping operations secure and efficient.
💡 Why This Matters
The Bonrix IoT/M2M Remote Device Monitoring System isn’t just a dashboard. It’s a control center for modern operations. By combining real-time monitoring, historical analysis, trip tracking, and specialized reporting, businesses can:
✔ Improve equipment uptime and reliability
✔ Enhance operational safety with timely alerts
✔ Optimize fleet performance through data-driven insights
✔ Make informed, proactive business decisions
📌 Whether managing industrial equipment or vehicle fleets, this platform offers the scalability, intelligence, and flexibility modern enterprises need.
👉 At Bonrix, we’re not just monitoring machines — we’re helping organizations build smarter, data-driven futures.
#IoT #M2M #RemoteMonitoring #DeviceMonitoring #Bonrix #FleetManagement #IndustrialAutomation #PredictiveMaintenance #SmartDevices #Telematics #RealTimeData #DataVisualization #DataAnalytics #SmartIndustry #Industry40 #DigitalTransformation #OperationalExcellence #ConditionMonitoring #MachineMonitoring #ConnectedDevices #IoTPlatform #IIoT #CloudIoT #IoTAnalytics #DeviceManagement #SmartFleet #FleetAnalytics #FleetTracking #AssetTracking #GPSMonitoring #EnergyMonitoring #CompressorMonitoring #PumpMonitoring #EquipmentMonitoring #IndustrialIoT #IoTSolutions #IoTInnovation #MachineData #SmartOperations #IoTDashboard #IoTReporting #BigDataAnalytics #OperationalIntelligence #RemoteAssetManagement #SmartAutomation #IoTIntegration #IoTServices #ConnectedEcosystem #IoTMonitoring #IndustrialTech #SmartMonitoring