IOT Email
iot.bonrix@gmail.com
Contact no
+91 7201045500
WhatsApp No
+91 7201045500
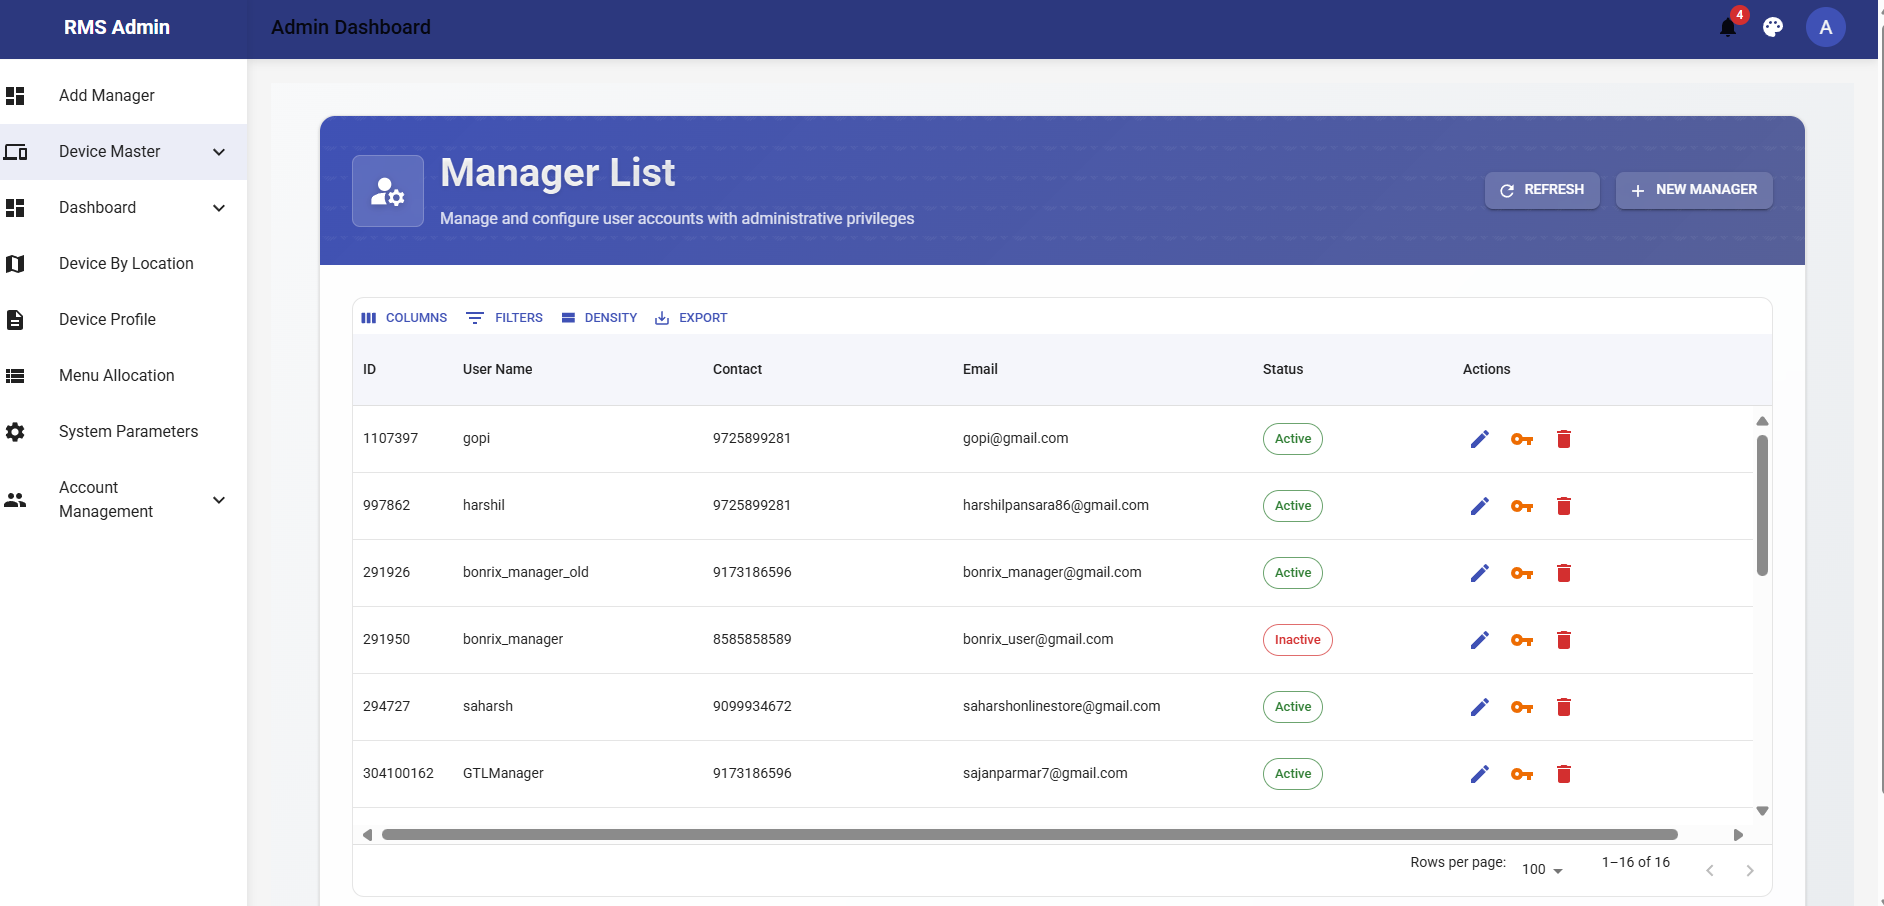
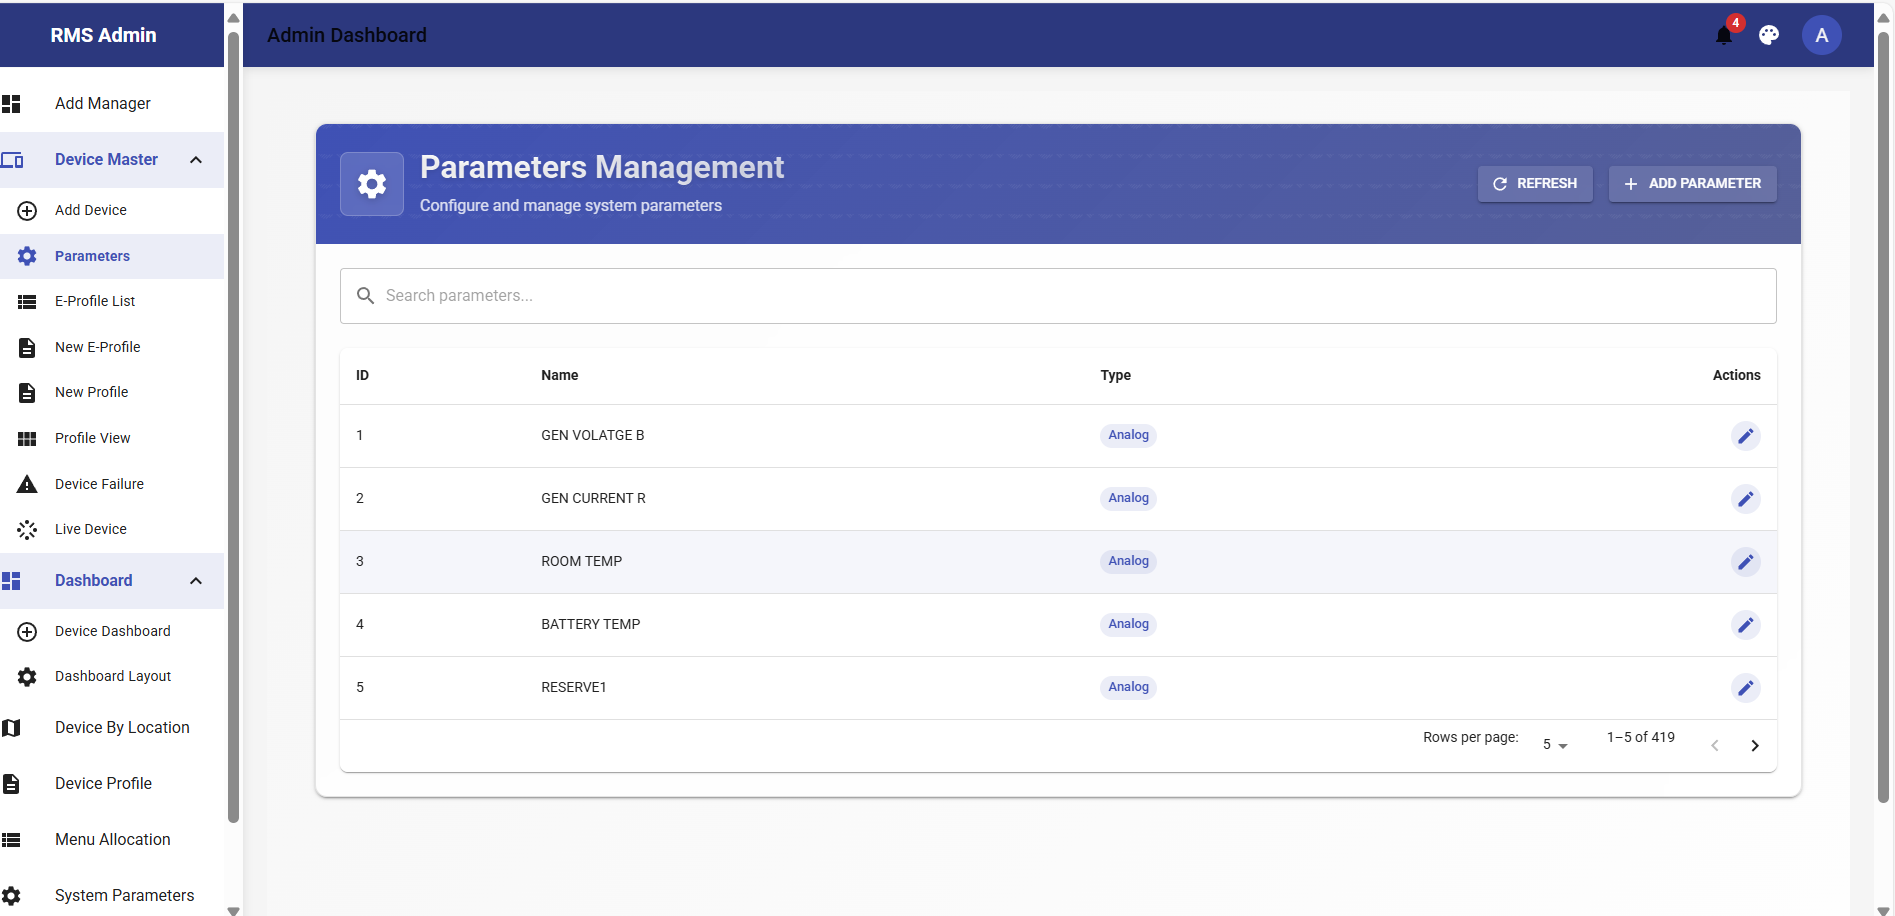
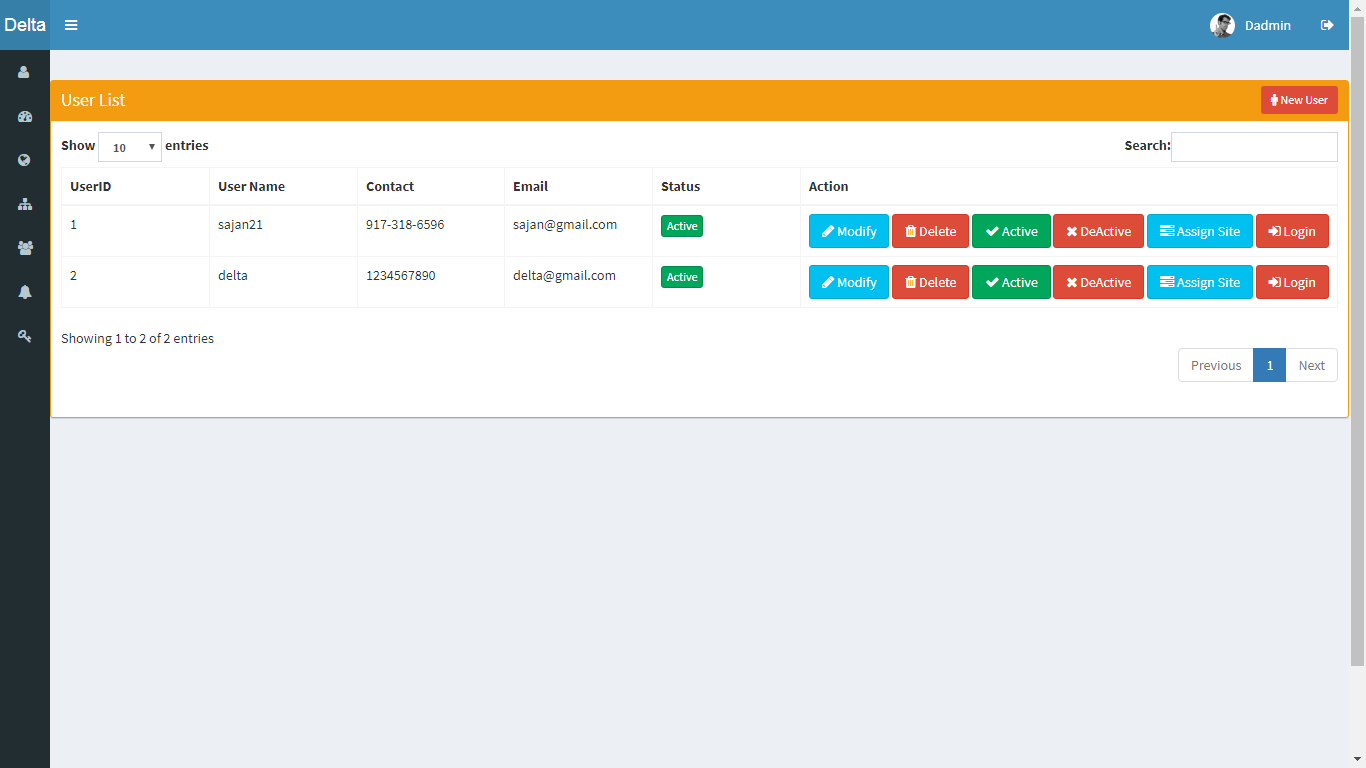
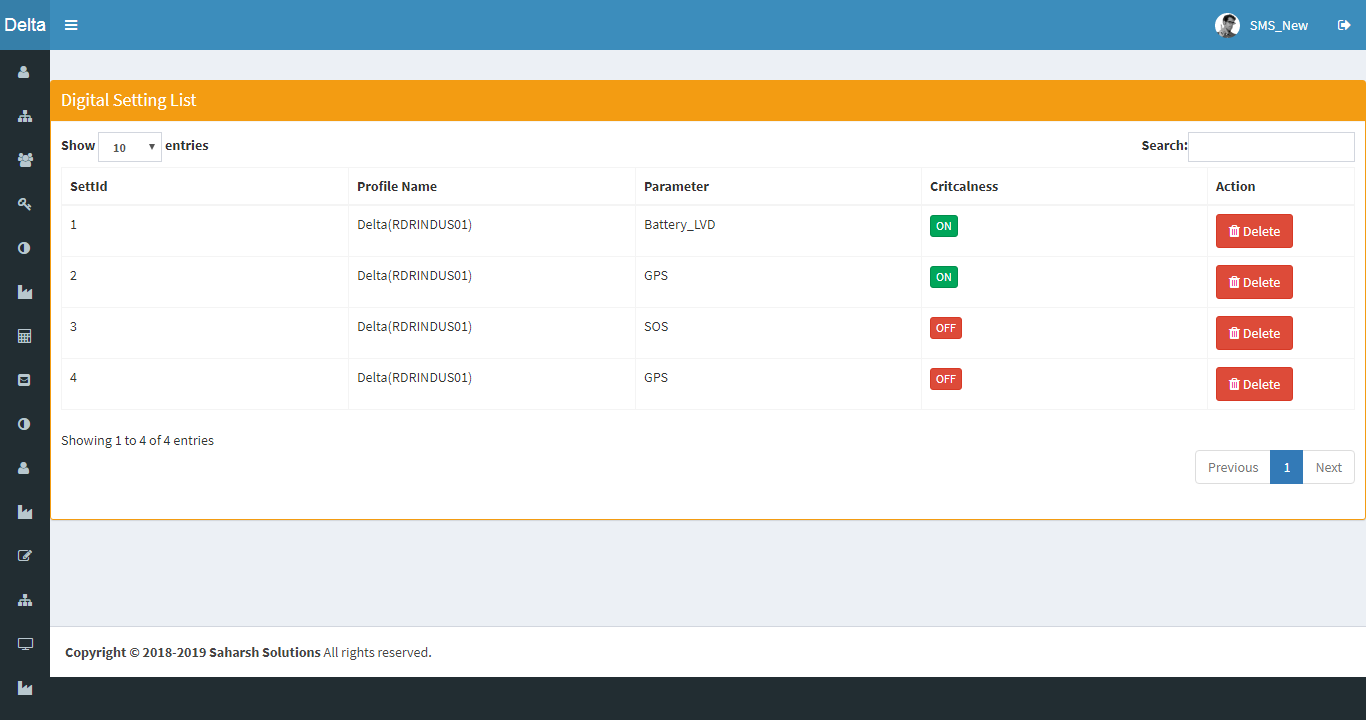
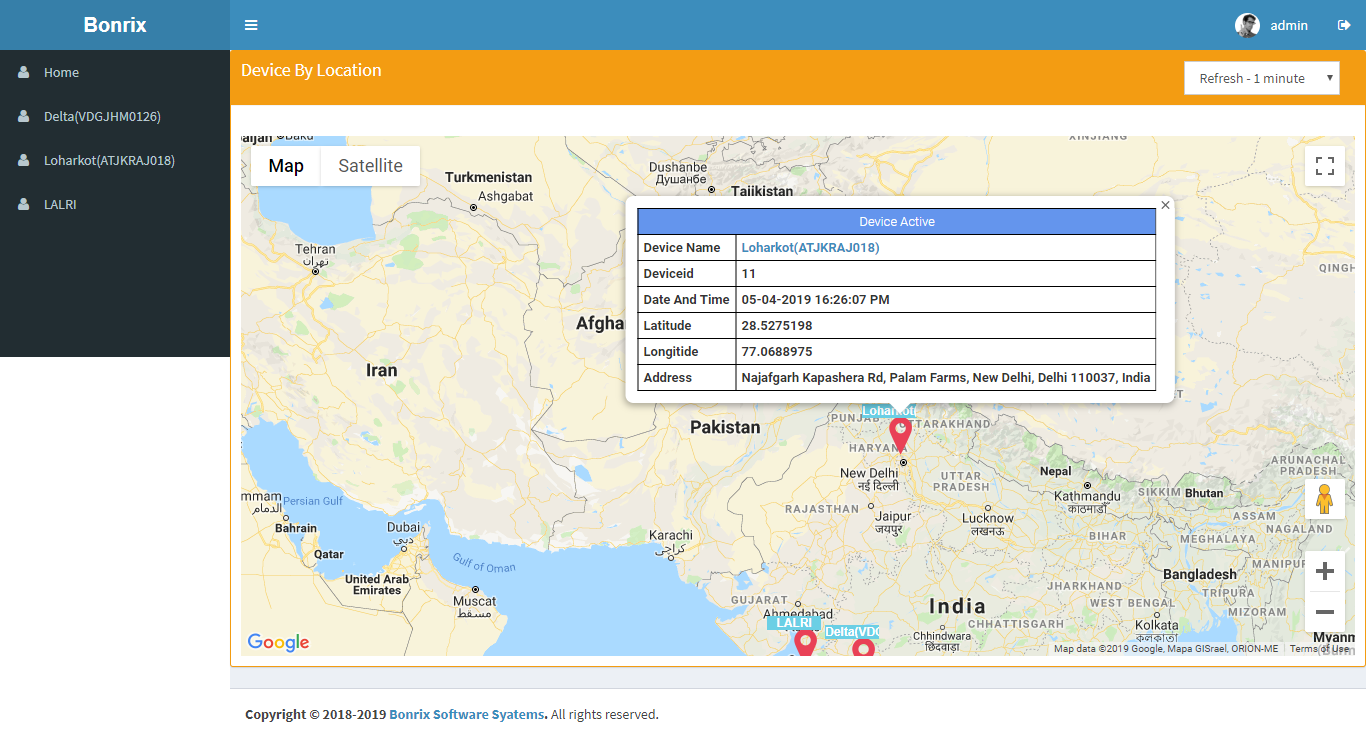
RMS Admin Panel Screenshot

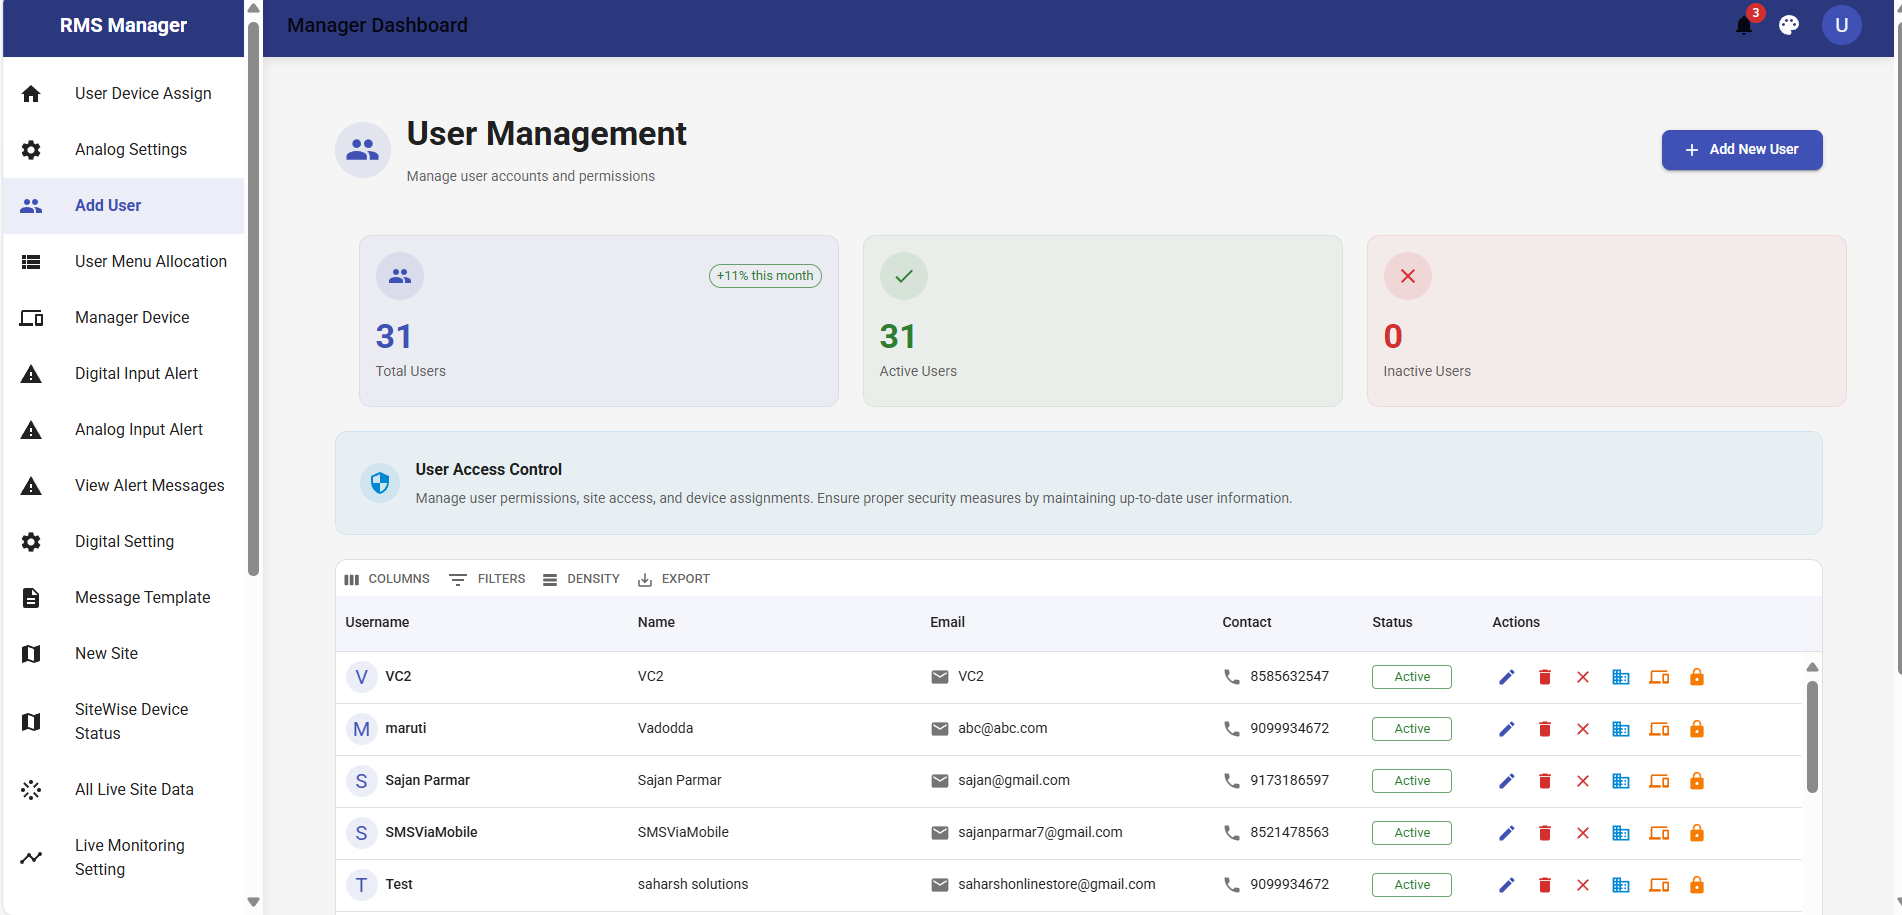
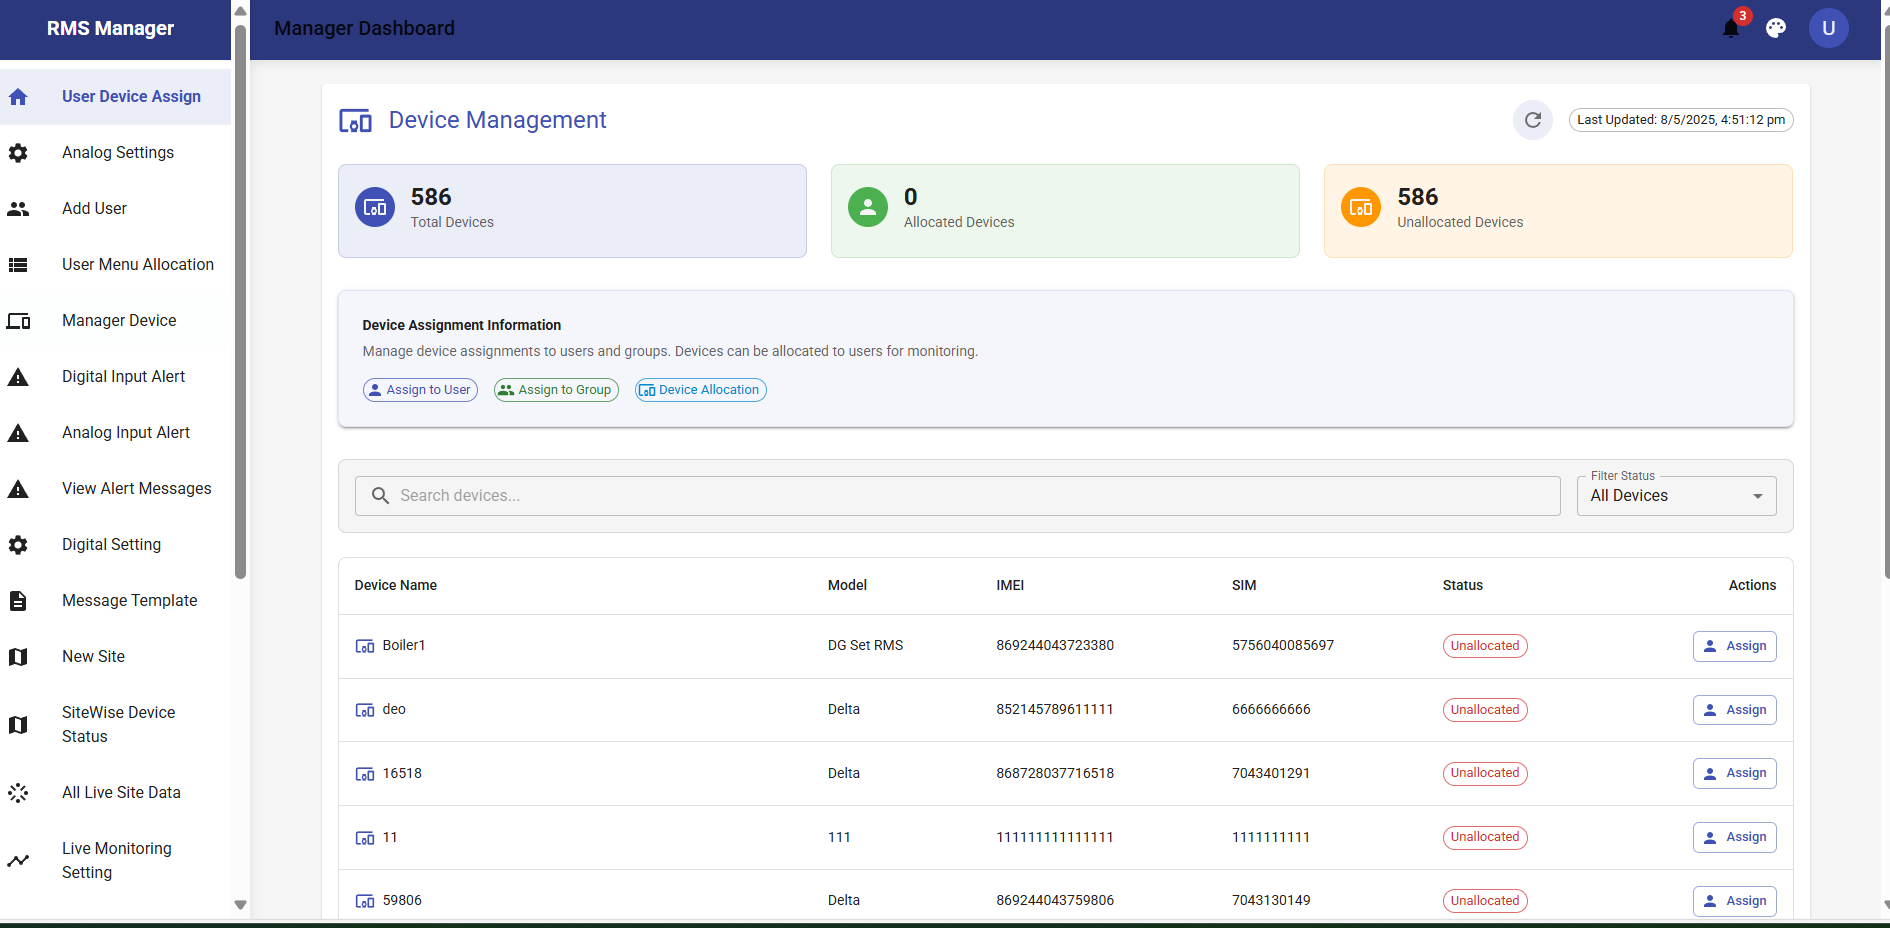
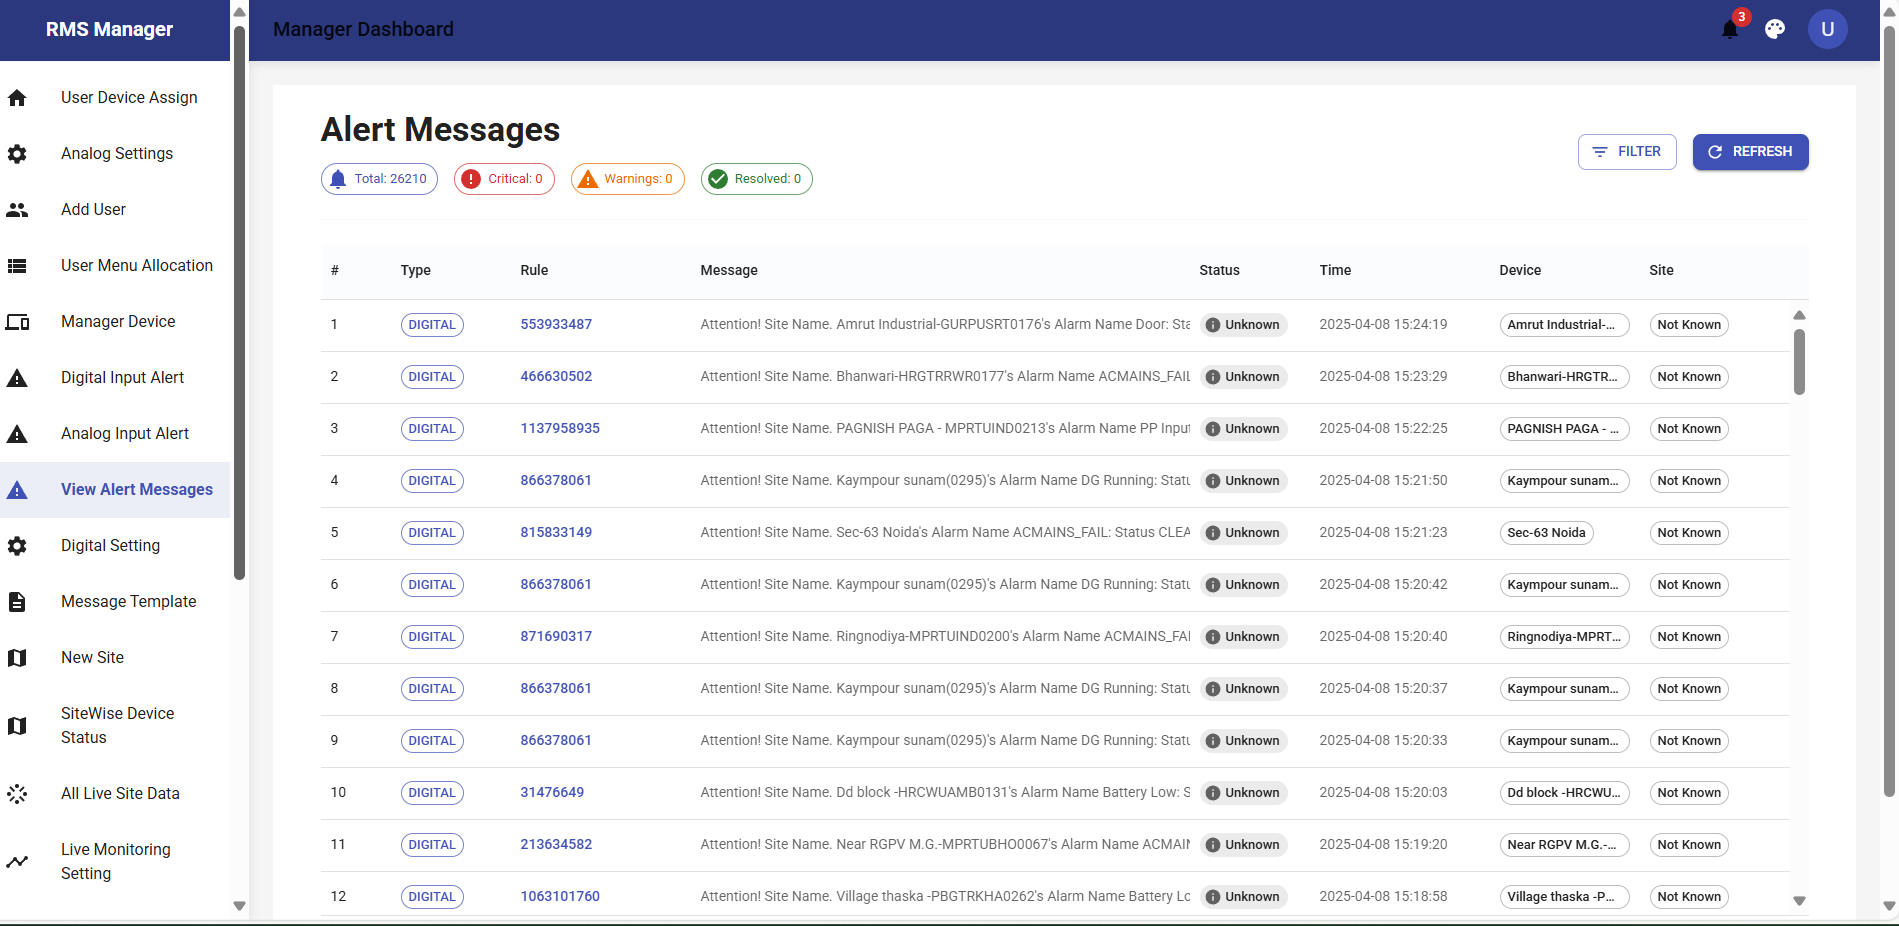
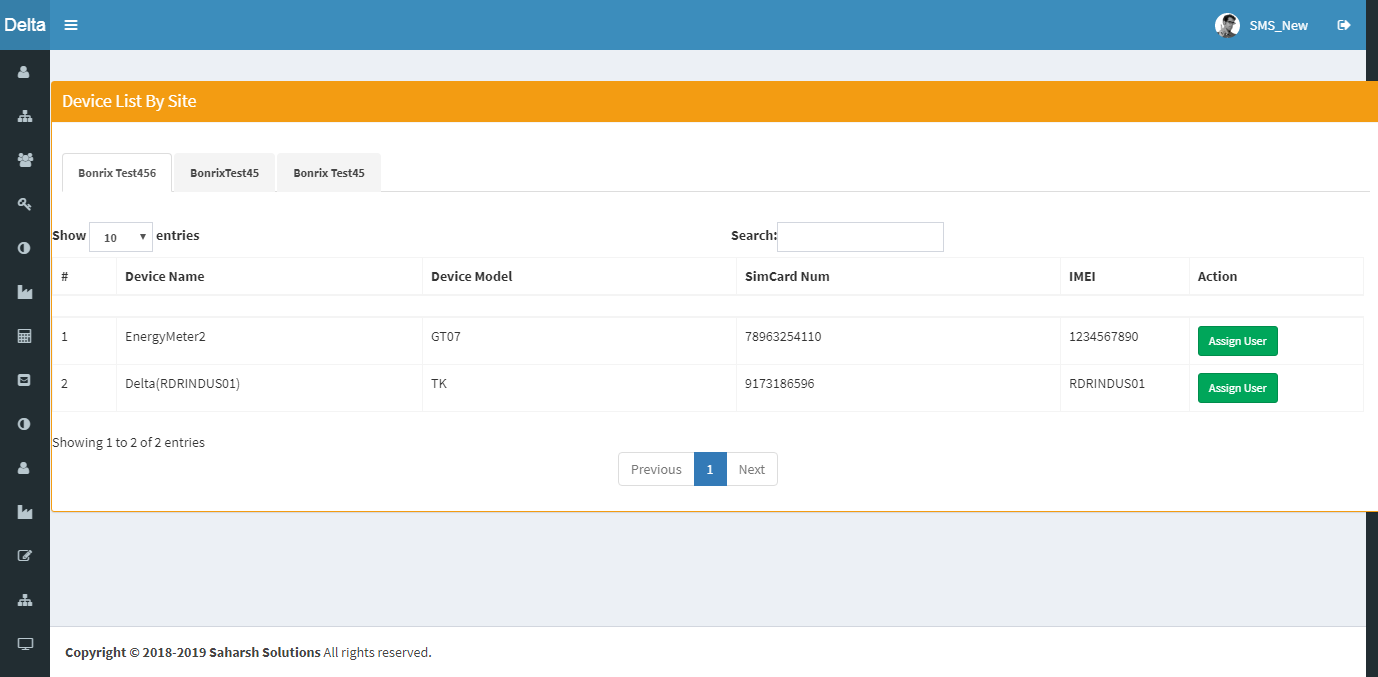
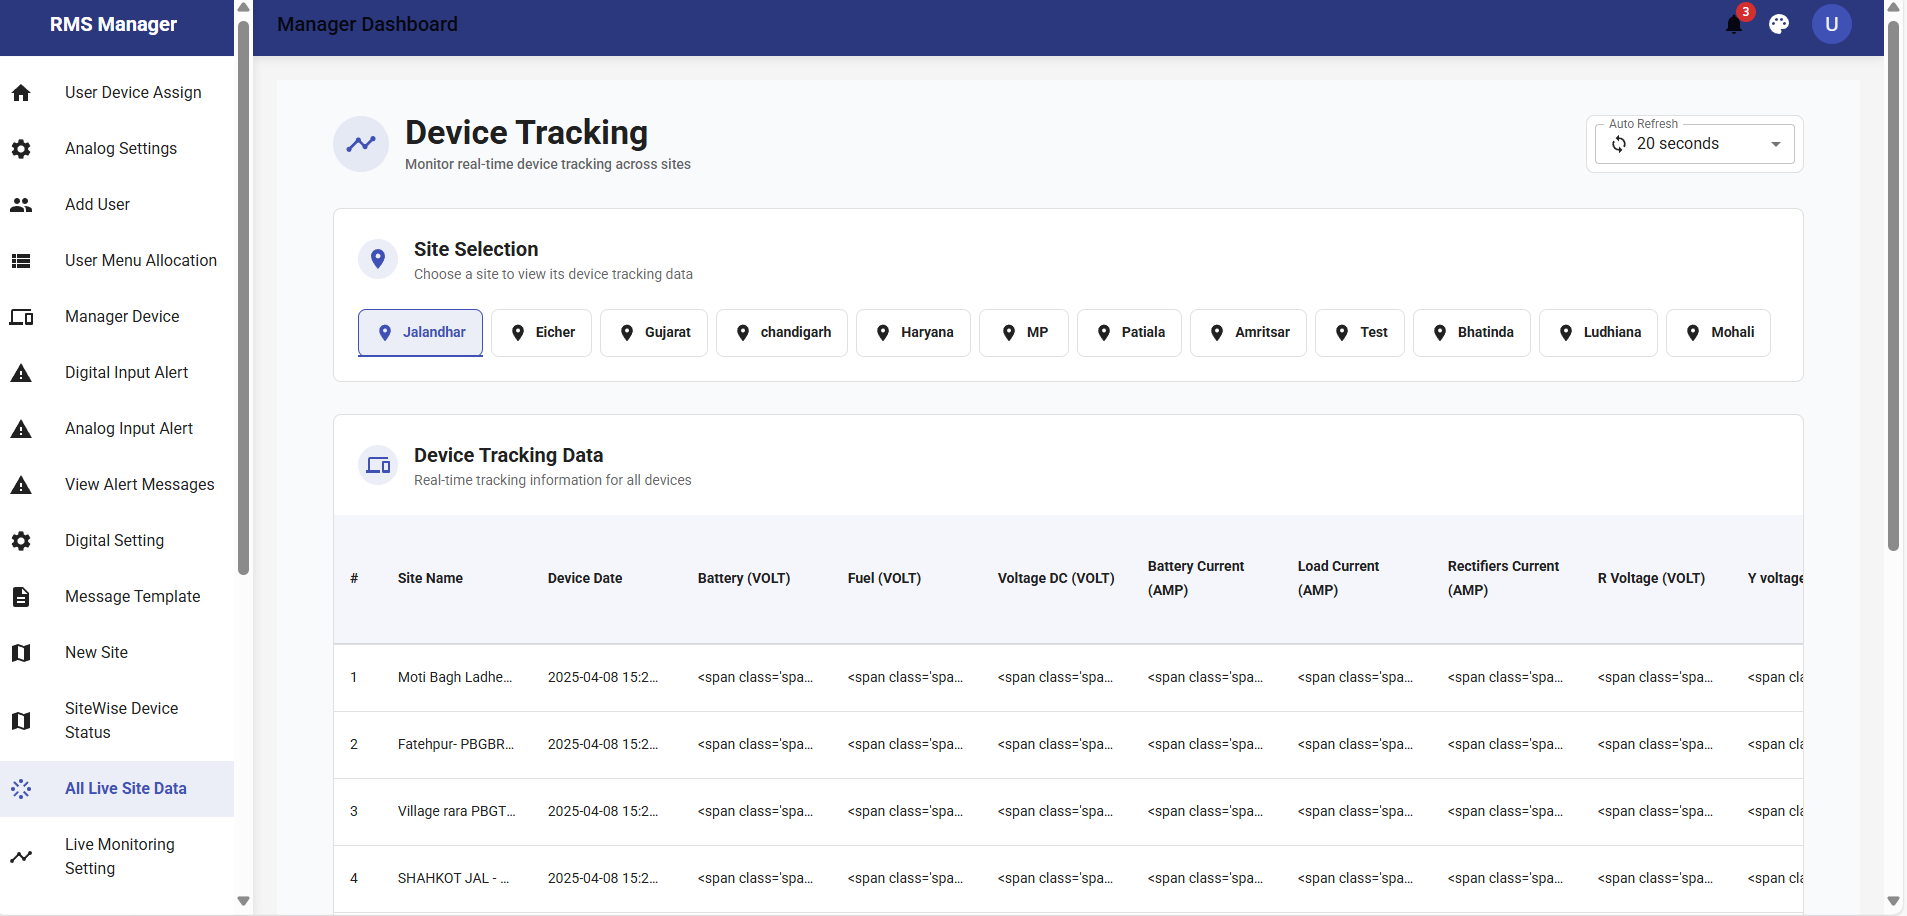
RMS Manager Panel Screenshot
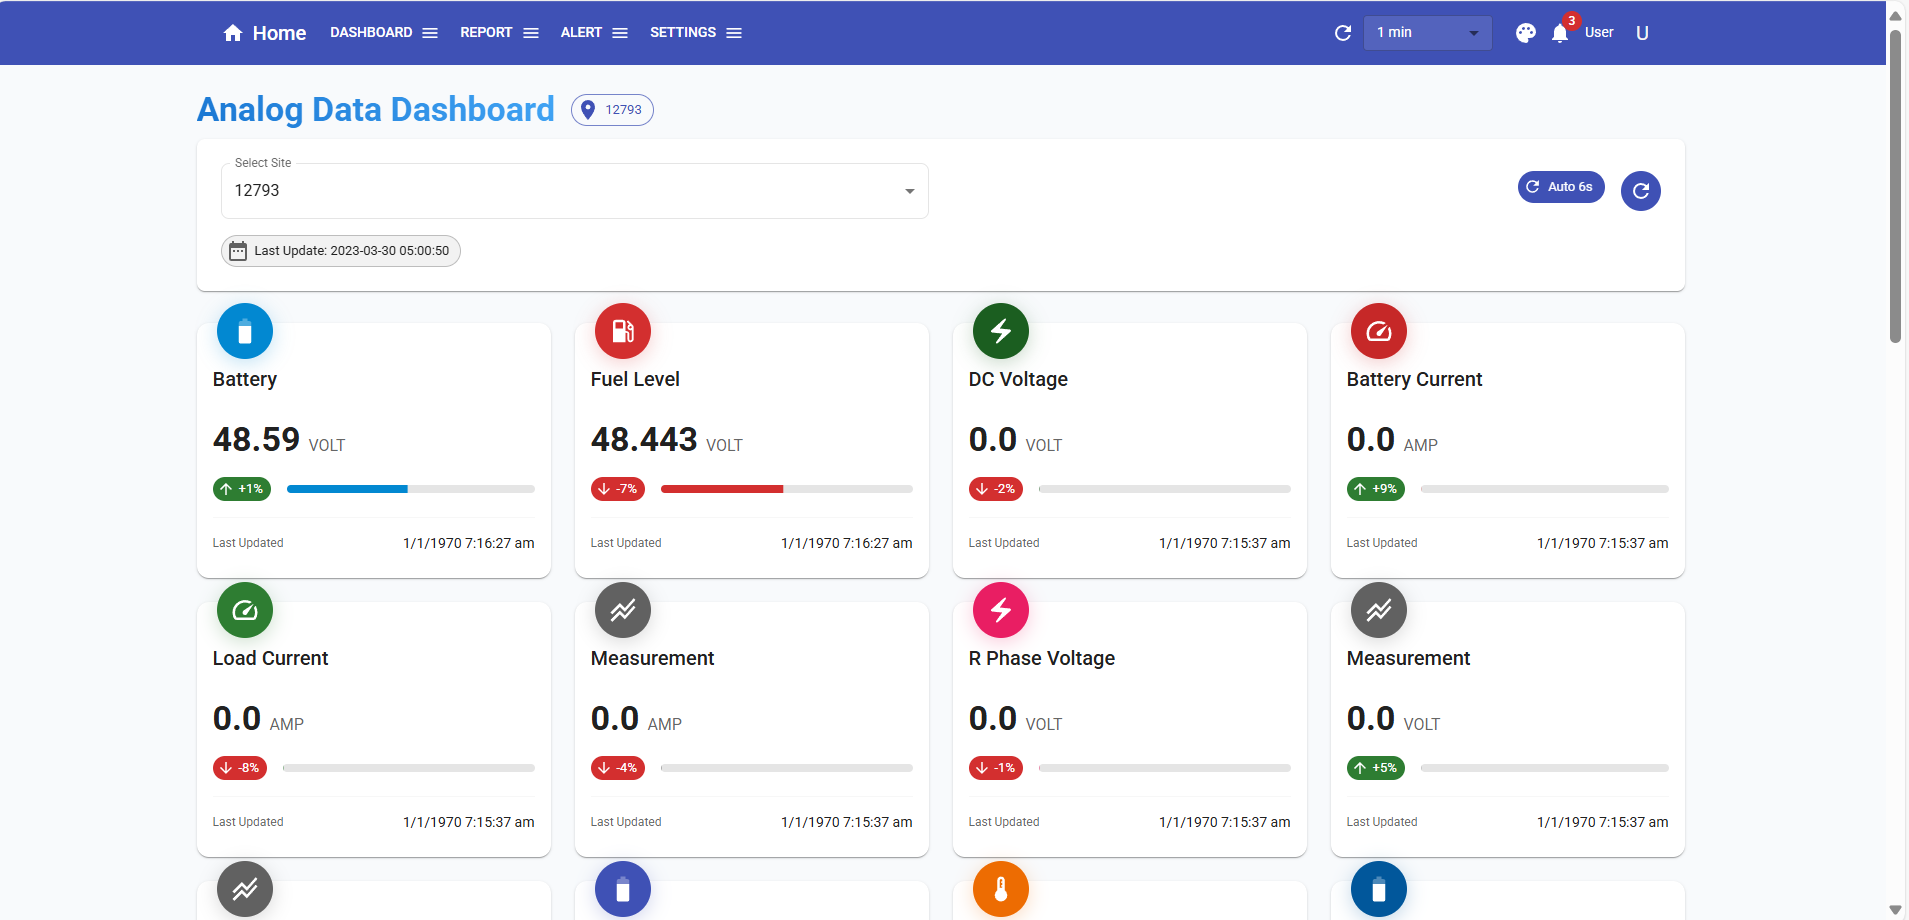
RMS User Panel Screenshot

🚀 Revolutionizing IoT Operations with Bonrix’s Real-Time Alert Monitoring Dashboard! 🚀
At Bonrix Software Systems (Ahmedabad, Gujarat), we’re empowering industries with our cutting-edge
IoT Alert Dashboard — a comprehensive solution for remote device monitoring and operational excellence.
📊 Why Our Dashboard Stands Out
✅ Real-Time Alerts
Stay ahead with live updates on critical issues like power failure, security breaches, environmental changes, and more.
📈 Trend Analysis
Track alert patterns over time to predict and prevent future failures before they happen.
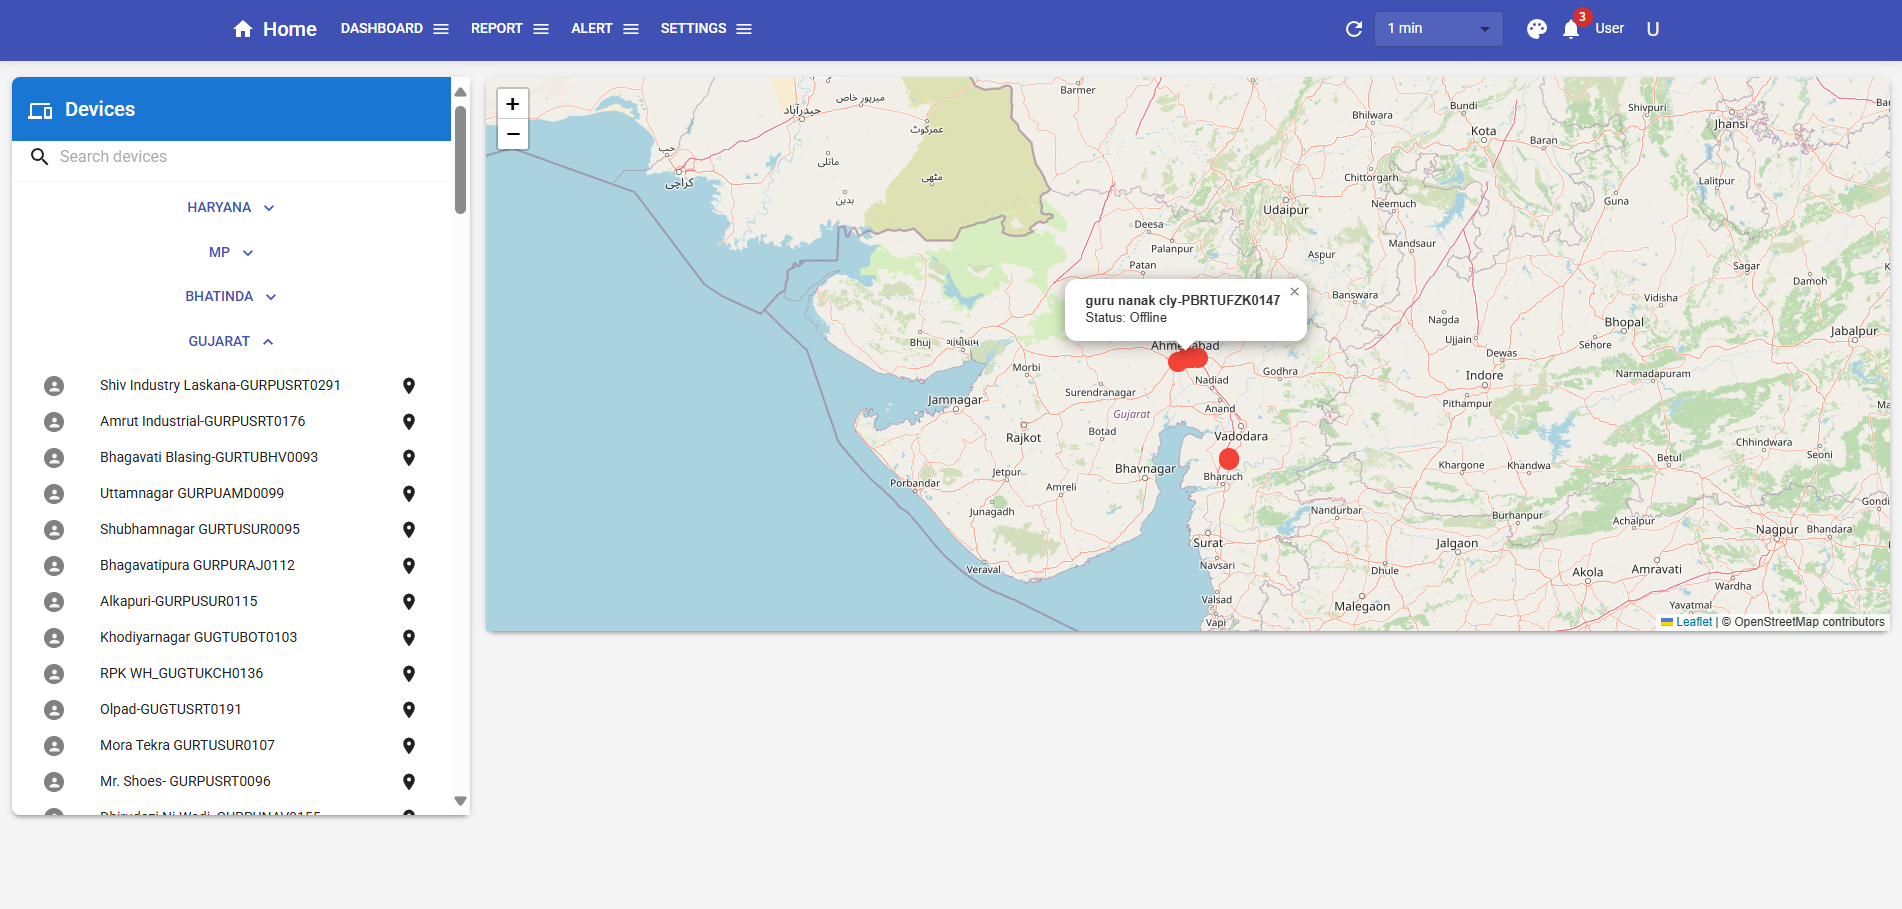
📍 Site & Type Breakdown
Visualize top problem areas (e.g., Gujarat, Jalandhar) and frequent alert types (Door breach, Battery Low).
⏱️ Performance Insights
Measure resolution times, identify bottlenecks, and optimize team efficiency across locations.
📊 Advanced Analytics
Heatmaps reveal alert hotspots by hour/day; resolution trends track progress over 30 days.
🌐 Industries We Serve
We cater to mission-critical sectors including:
- 📡 Telecom Towers
- 🏢 Facilities Management
- 🏭 Industrial Infrastructure
- ⚡ Energy & Utilities
Where uptime is non-negotiable, we ensure reliability and control.
💡 Proactive Maintenance, Smarter Decisions
Our platform transforms raw data into actionable insights, helping you reduce downtime, improve response times, and boost overall system stability.
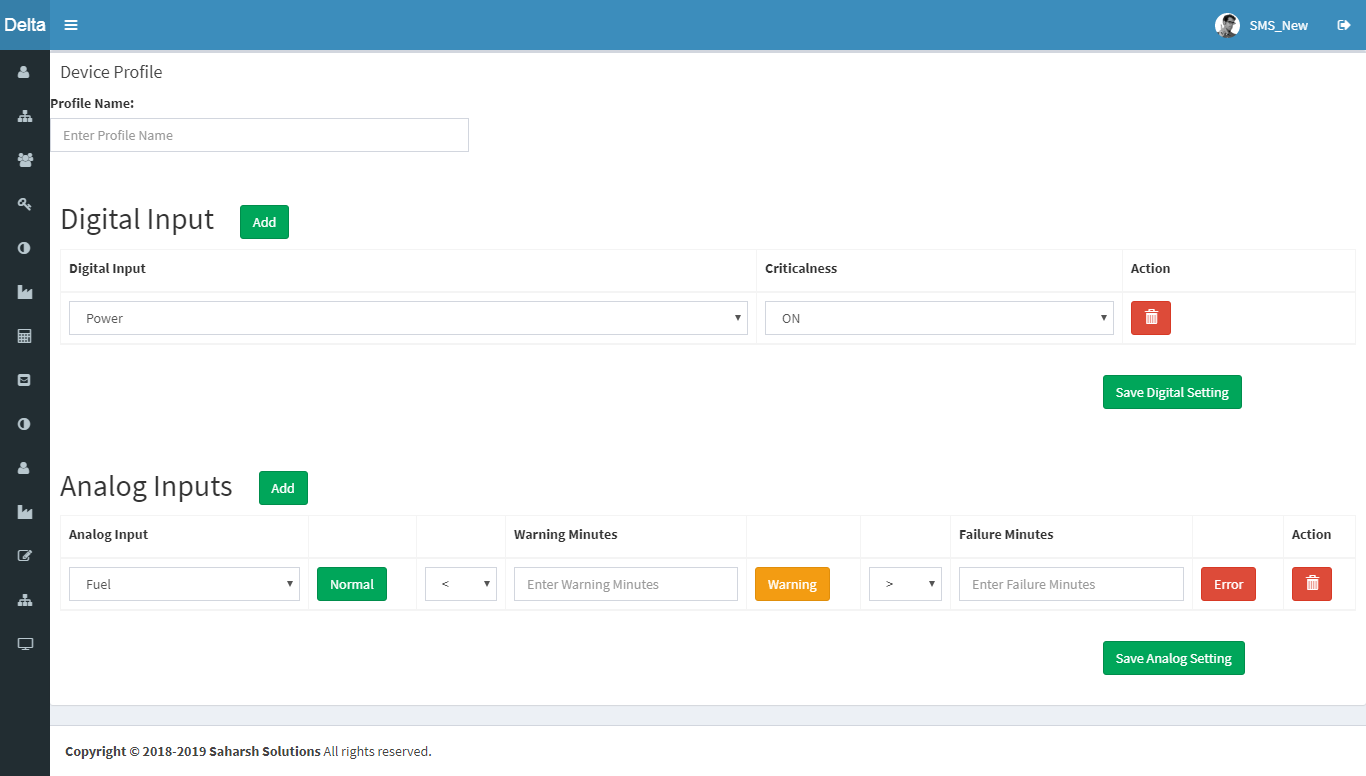
🔧 Purpose-Built for Operational Monitoring & Alert Management
Our IoT Alert Dashboard is designed for industries managing remote equipment installations, telecom towers, or facilities where power, security, and environmental conditions require constant vigilance.
- Monitor real-time alerts for immediate action.
- Analyze trends and performance metrics to identify recurring issues.
- Investigate root causes through data correlation (e.g., alert types by location or time).
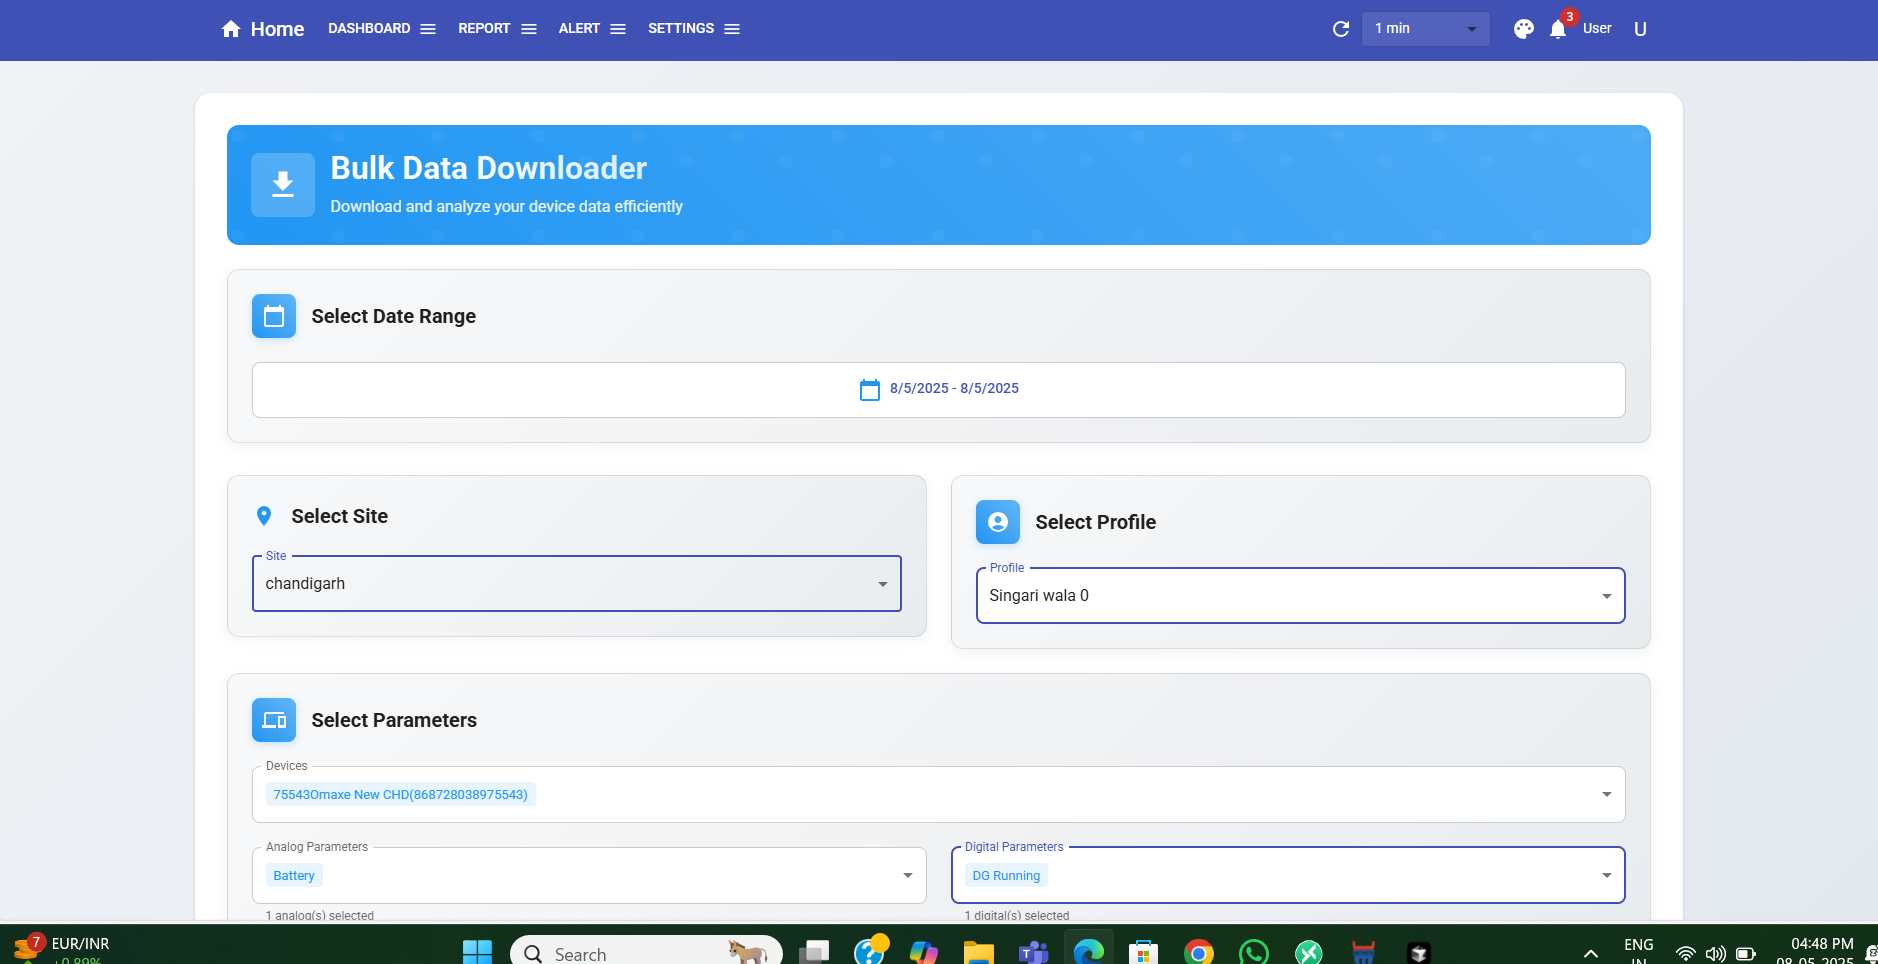
📊 Key Features & Functionalities
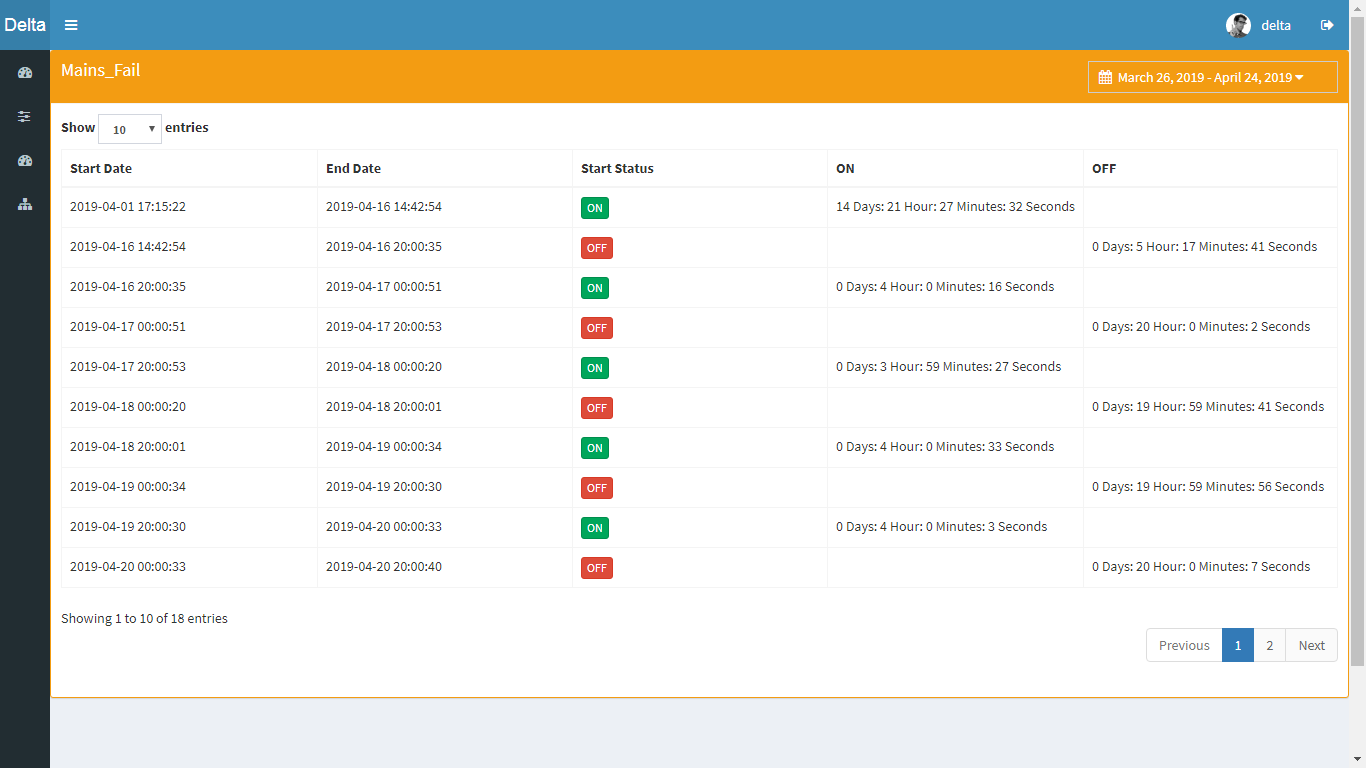
1. Real-Time Alerts
- Date Range Selection: Filter data for specific periods to focus on relevant trends.
- Refresh Button: Instantly update the dashboard with the latest alert status.
- Trend Analysis: A daily alert bar chart highlights fluctuations in alert volume, with key metrics like "Peak Day", "Daily Average", and "Active Days".
2. Site-Wise Alert Distribution
- Donut Chart: Visualizes the percentage of alerts per site (e.g., Jalandhar, Gujarat, Chandigarh).
- Stacked Bar Chart: Breaks down alerts by type (e.g., ACMAINS_FAIL, Battery Low, Door) for each location, enabling targeted troubleshooting.
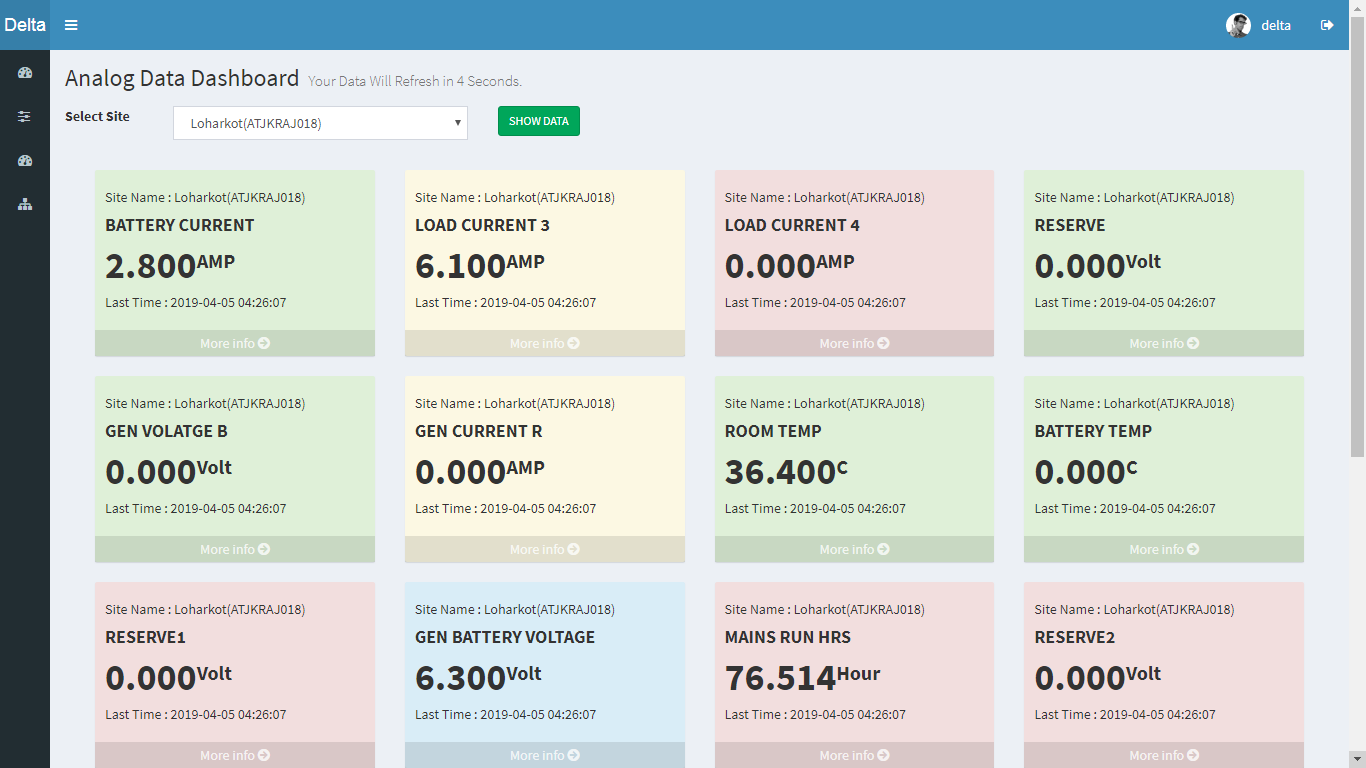
3. Alert Type Analysis
- Vertical Bar Chart: Displays the frequency of different alert types, identifying common issues like Door breaches, PP Input Failures, or Battery Low warnings.
- Average Alert Duration Chart: Highlights which alert types take the longest to resolve, guiding process improvements.
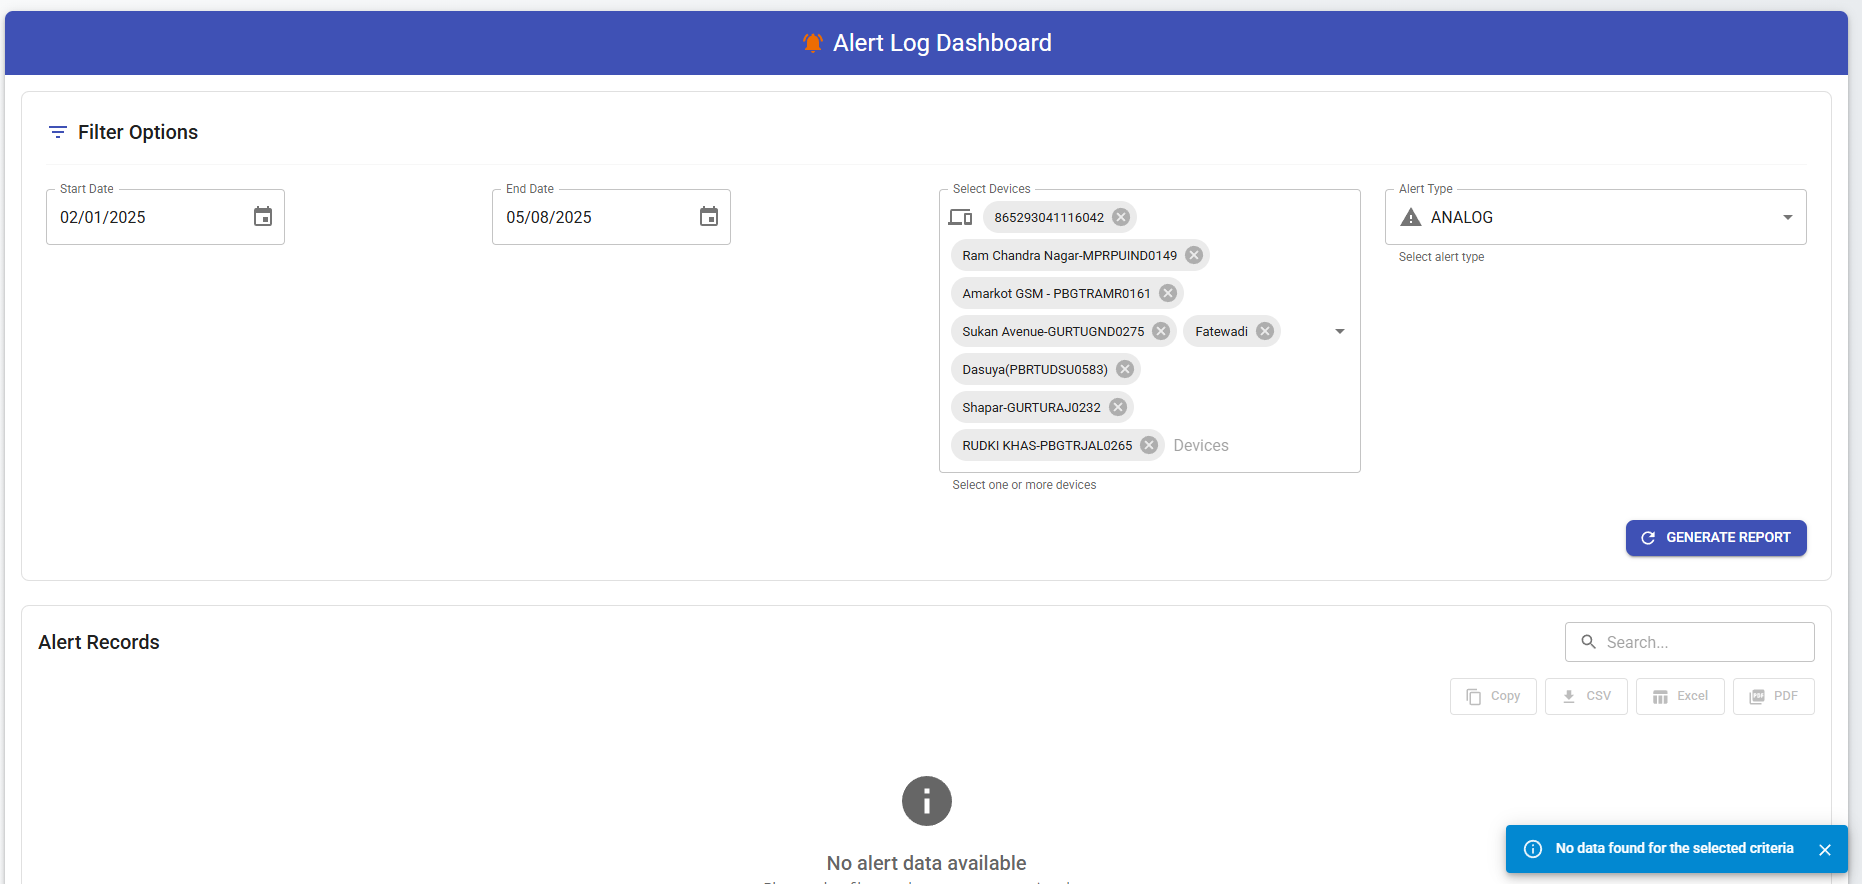
4. Active Alerts at a Glance
- Current Alerts Donut Chart: Shows live alert types with a quick-reference legend (e.g., "Door: 1 active").
- Active Alert Details Table: Lists individual alerts with specifics like ID, Site Name, Alert Type, Duration, and Status for rapid response.
5. Advanced Analytics for Strategic Insights
- Frequency Heatmap: Reveals patterns in alert occurrences by hour/day, aiding workforce planning.
- Resolution Time Trend: Tracks average alert resolution times over 30 days, measuring team efficiency.
✅ Why Choose Bonrix’s IoT Alert Dashboard?
- Proactive Maintenance: Identify and resolve issues before they escalate, reducing downtime.
- Data-Driven Decisions: Leverage trend analysis and root cause insights to optimize infrastructure performance.
- Scalability: Tailored for mission-critical sectors including telecom towers, energy systems, and industrial facilities.
- User-Friendly Interface: Intuitive charts and filters ensure seamless navigation for both technical and non-technical teams.
💡 Transform Your Operations with Bonrix
By integrating physical infrastructure monitoring with advanced analytics, our dashboard ensures you stay ahead of operational risks. Whether tracking power outages, environmental hazards, or security breaches, Bonrix delivers the tools to enhance reliability and efficiency.
At Bonrix Software Systems , headquartered in Ahmedabad, Gujarat, India, we specialize in developing cutting-edge IoT Dashboard Solutions tailored for industries where real-time monitoring and proactive maintenance are critical.
Our IoT Alert Dashboard is a robust platform designed for remote device alert monitoring , enabling businesses to streamline operations, enhance infrastructure reliability, and optimize resource allocation.

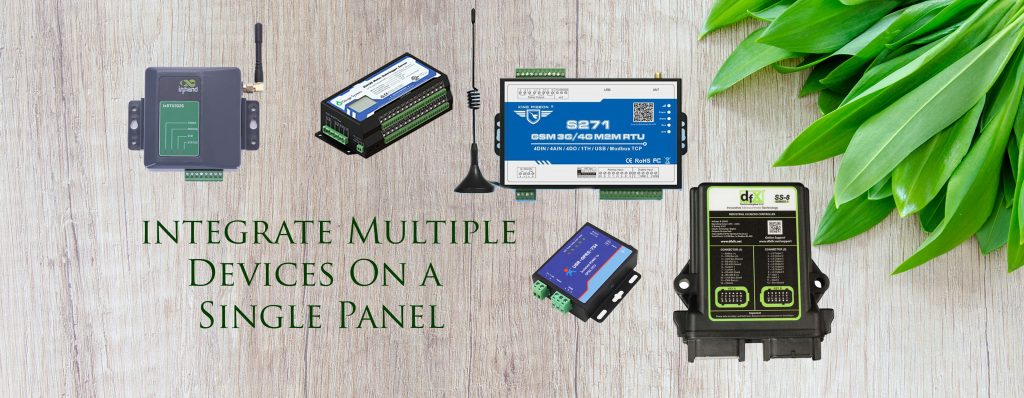
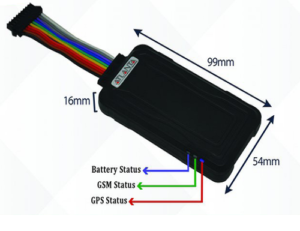 L100
L100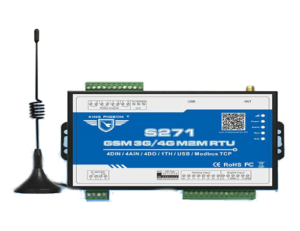 GSM_S-271
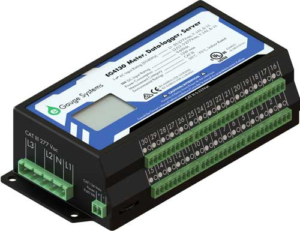 eGaugePro
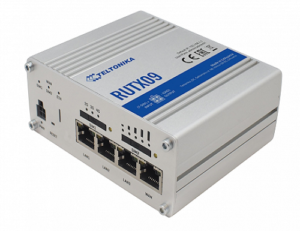 RUTX09
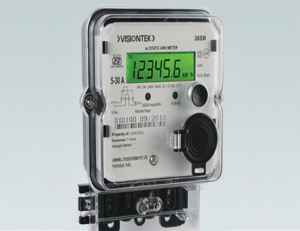
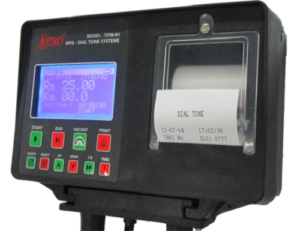
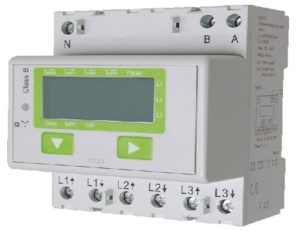
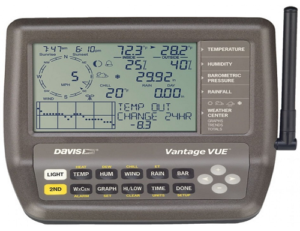 Weather Station IOT Meter
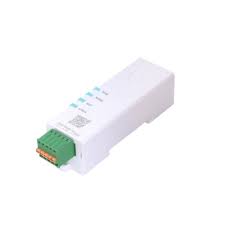


